Miners moved higher yesterday, and while they didn’t move up as much as they had moved down on Monday, some might say this was bullish.
I disagree. It was normal. And I have a chart to back it up.

The above chart features the GDXJ from the hourly point of view – each candlestick represents 1 hour. This perspective can be misleading while trying to project long-term price moves, but it does a great job of discovering very short-term similarities and applying the technical analysis in this way. For example, it can shed some light on what type of intraday behavior is normal after a top and what type of behavior is not normal, suggesting some kind of change in the pattern/trend.
Thanks to this perspective, we know that seeing a small upswing right after the initial post-top decline is something normal. I marked the current situation as well as the analogous (mid-September and mid-May) situations with black arrows.
Since this kind of performance took place after tops and before the vast majority of the short-term move lower, it’s actually a bearish confirmation – not a bullish invalidation.
Let’s zoom out to the very long-term point of view.
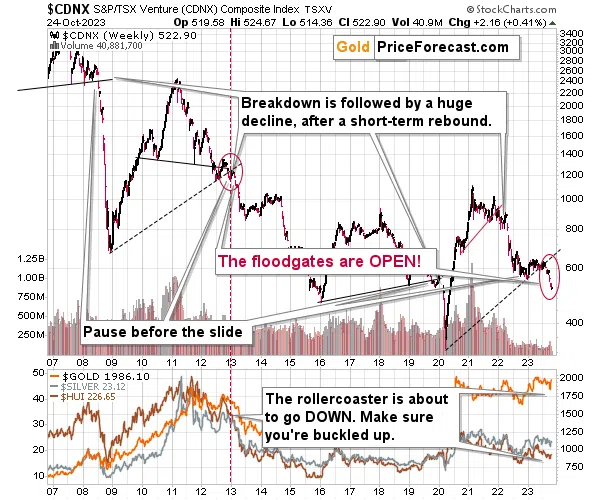
The above chart features the Toronto Stock Exchange Venture Index, which serves as a long-term proxy for junior miners, as so many of them are listed in that index. The TSXV is not something covered frequently by most gold experts, and in my view – incorrectly so.
The thing is that this index not only broke below its long-term support line, but also moved visibly lower, and we saw something very similar in 2008 and 2013 in the early parts of the massive declines in the mining stocks (and in the rest of the precious metals sector). That’s the key piece of news.
So, while the very short-term chart suggests that the mining stocks are about to move lower shortly, the long-term chart shows just how dire the situation really is.
Also, did you see that the USD Index just reversed after (almost) touching its 50-day moving average?

Back in June 2022, after a similarly big rally, the USD Index finished its pullback very close to that moving average. Consequently, seeing a similar move and then a sharp rebound might indicate that the correction is already over and that another big move higher in the USDX is about to start.
This, of course, is likely to have negative implications for the precious metals sector. After all, the price of gold can’t really disconnect from the value of the currency it’s being priced in.
All in all, it seems that the profits on the short position that we entered in GDXJ on Friday above $35 are going to increase soon.
Thank you for reading our free analysis today. Please note that the above is just a small fraction of the full analyses that our subscribers enjoy on a regular basis. They include multiple premium details such as the interim targets for gold and mining stocks that could be reached in the next few weeks. We invite you to subscribe now and read today’s issue right away.
Sincerely,
Przemyslaw K. Radomski, CFA
Founder, Editor-in-chief