Trump ordered the Navy to "shoot and kill" any Iranian boat laying mines in the Strait of Hormuz.
"There is to be no hesitation," he wrote on Truth Social. He ordered mine sweeping to continue "at a tripled-up level." Then he claimed "total control" of the Strait: "No ship can enter or leave without the approval of the United States Navy. It is sealed up tight."
Minutes later, he reposted a Washington Post opinion piece titled: "Trump doesn't need a deal to get what he wants from Iran."
That's the posture. No urgency. No timeline. No deal needed. When reporters pressed him at the White House about exceeding his own 4-6 week war timeline (it's now Day 55), Trump said: "Don't rush me. I want to make the best deal. I could make a deal right now, but I don't want to do that. I want to have it everlasting."
Gold is essentially flat today. Oil pulled back slightly after surging above $106 overnight (Brent, per Al Jazeera). Silver is modestly higher. The dollar is slightly lower. The Nasdaq is leading on the upside.
Shoot to Kill, During a Ceasefire
The shoot-to-kill order on mine-laying boats is the most direct escalation since the blockade began on April 13. If the IRGC continues deploying mines (the Pentagon says they've been doing this since March), this order creates the conditions for kinetic engagement during a supposed ceasefire. One US destroyer sinking an IRGC speedboat caught placing mines would immediately change the conflict's character.
Italy announced it will deploy two minesweepers, an escort vessel, and a logistics ship to the Strait as part of an international coalition. Navy chief Berutti Bergotto told RAI: "Obviously we are not acting alone. We are part of an international coalition, and other nations will also send minesweepers." Over 30 nations met at the UK's Permanent Joint Headquarters in London this week to plan the multinational mine clearance operation. The Pentagon has said full mine clearance could take up to six months.
BIMCO, the world's largest shipping association, said shipping companies need assurances from both Iran AND the US before they will transit the Strait. Jakob Larsen, BIMCO's chief safety officer, called mines a "particular concern." That tells you how far the Strait is from reopening. Even if Iran and the US both declared the war over tomorrow, it would take months before commercial traffic returns to normal.
The Strait remains effectively closed. Only 8 ships transited on Wednesday, including 3 oil tankers, according to LSEG tracking data. Pre-war normal: 100+ ships daily. That's 8% of normal traffic.
Oil Back Above $100
Brent surged to $106.80 early Friday (Al Jazeera), crossing $100 for the first time in two weeks. Brent is now up from below $94 just one week ago to above $105. The flag pattern breakout is accelerating.
Crude oil is also rallying, but it has yet to get back above the $100 level.
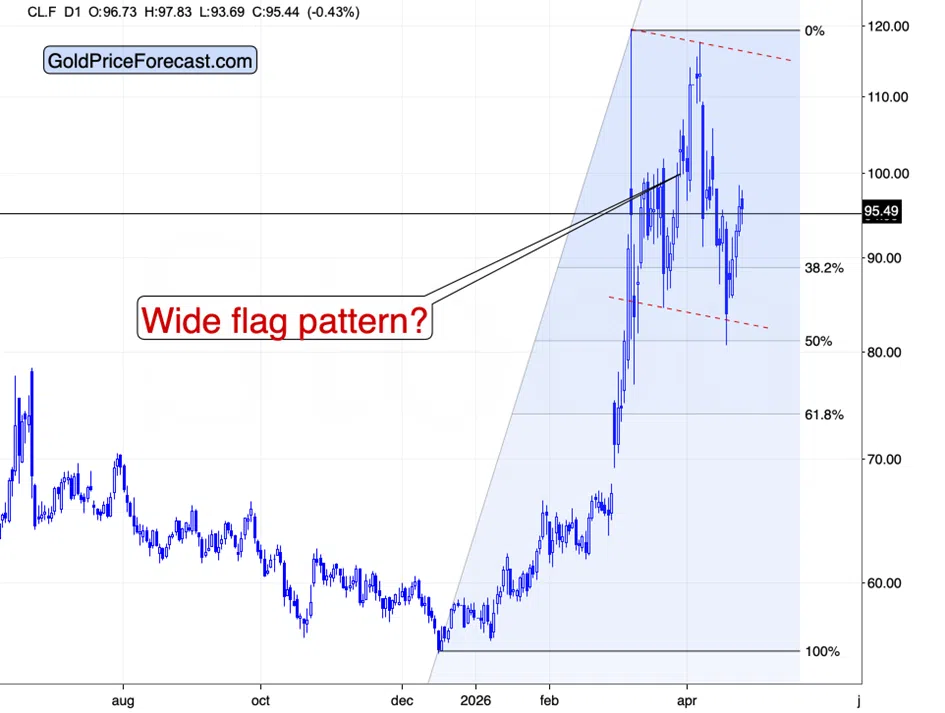
The measured move target from the flag pattern I've been tracking implies crude oil above $170 if the pattern completes. The fact that the Strait remains almost closed supports this outlook from the fundamental point of view.
Each act of IRGC aggression (two ships seized on Wednesday, two ships fired on Tuesday, gunboat attacks on Saturday) reinforces the structural supply disruption that powers the pattern.
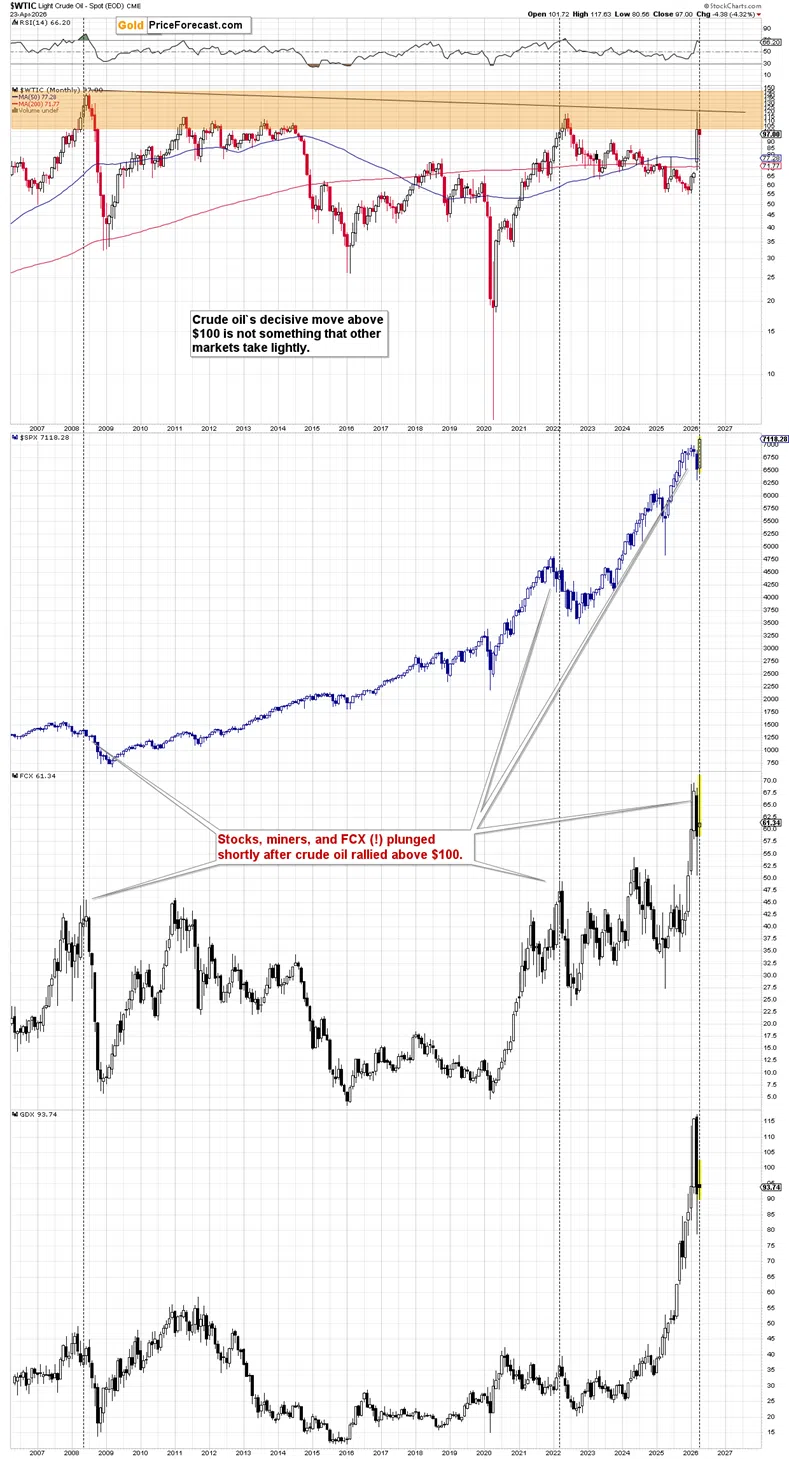
Please keep in mind that even at the current prices, crude oil suggests huge declines in stocks and commodities in the following months.
On a short-term basis, we see a pause that followed a sharp decline – at least in the mining stocks – and it’s perfectly natural.
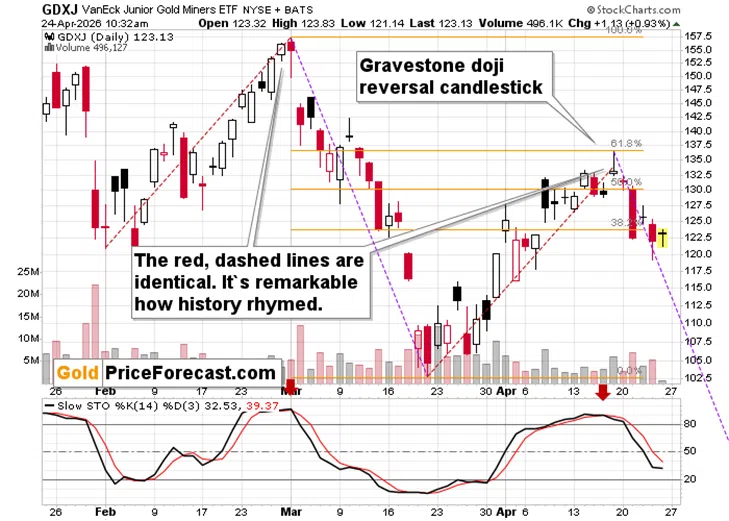
I just realized something specific about the recent upswing. Namely, it was identical (in terms of time) / almost identical (in terms of price), to the February rally. I marked the latter with red, dashed line, and I copied the line to the March bottom. It’s remarkable that it ended right at the recent top.
If I measured the moves based on the closing prices instead of the intraday extremes, the alignment would have been even clearer.
Now, if the rallies were near-identical, then perhaps the follow-up will also be alike. That’s what I used the purple, dashed lines for. It turns out that the current pace of decline in the GDXJ is in perfect tune with how it had declined in March.
This confirms the bearish case for the following weeks.
In the full version of today’s analysis (the Gold Trading Alert), I’m discussing implications for the precious metals market in greater detail, but here, I’d like to show you one major commodity-related sell signal that you might have missed.
The FCX is one of the key gold and copper producers, and it’s known to be particularly volatile during times when commodities and stocks decline together.
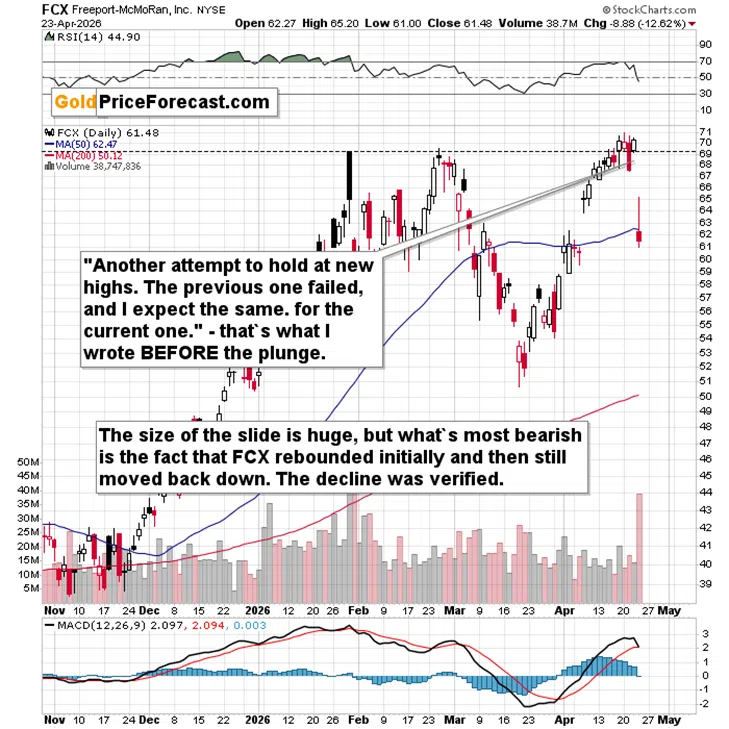
Quoting my yesterday’s Gold Trading Alert:
“The FCX just invalidated its move above the previous highs, thus flashing a major sell signal. Yesterday, it moved back above those highs, but the volume was relatively weaker, and I doubt that this breakout will hold.
The invalidation of the breakout and a weekly close clearly below the previous 2026 highs would set the stage for a powerful decline.”
FCX plunged within an hour after I posted the above. It looks like we’re going to get a clear weekly close below the previous 2026 highs, which sets the stage for a much bigger decline in the following weeks.
This is a sell signal that comes on top of multiple other signals that I discussed previously, and it’s one that’s important for other markets, as FCX tends to move together with copper, gold (no wonder, the company produces both metals), and mining stocks. While it won’t be the case that FCX drags other markets lower, it could serve as a canary in the coal mine.
Thank you for reading today's article – the free version of today's Gold Trading Alert (in which the analysis continues). Subscribers receive the full analysis with charts, technical levels, and trading positions daily. Gold Trading Alerts are available directly and through the Diamond Package.
Thank you.
Sincerely,
Przemyslaw K. Radomski, CFA