Congratulations! The rebound is taking place as expected and – most likely – in tune with your positions (or lack thereof).
It was just six days ago when I shared one of the Gold Trading Alerts with you. I emphasized that it was a good idea to temporarily close short positions in mining stocks as a rebound was coming. Indeed, it has arrived.
Also, it was just yesterday when I wrote that Trump will extend his ultimatum. We didn't have to wait long for this to become reality.
On Monday, Trump postponed his power plant strikes for five days, citing "very good and productive conversations" with Iran. Then the administration went further: a 15-point peace plan was sent to Tehran through Pakistan, and Israel's Channel 12 reported that Kushner and Witkoff are proposing a one-month ceasefire framework during which both sides would negotiate the deal's terms. Oil crashed 11% on Monday. Gold and silver rallied as the inflation pressure eased. Stocks surged. The pattern is familiar by now.
Here's the problem: Iran rejected the plan. Its military spokesperson mocked Washington on state television: "Have your internal conflicts reached the point where you are negotiating with yourselves? No one like us will make a deal with you. Not now. Not ever." Iran laid out five counter-demands, including full US withdrawal from the region, war reparations, and recognition of Iran's authority over the Strait of Hormuz. The US called these conditions "ridiculous." Meanwhile, Israel continued striking Tehran, and its military told NPR it needs "several more weeks of fighting" to complete its objectives. The Pentagon deployed 2,000-3,000 paratroopers from the 82nd Airborne to the region. You don't send the 82nd Airborne when you're about to sign a peace deal.
This is the third time in three weeks that the same cycle has played out: Trump de-escalation headline, oil drops, gold and silver rally on lower inflation expectations, stocks bounce. Then reality reasserts itself, oil climbs back (Brent was already back above $104 on Tuesday before dropping again on Wednesday on the 15-point plan news), and the corrective moves reverse. The one-month ceasefire proposal gives markets hope, and hope is enough to drive a short-term bounce. But hope without Iranian acceptance is a headline, not a resolution. Until the Strait of Hormuz actually reopens to normal commercial shipping, the structural oil picture hasn't changed, and neither has the pressure on gold, silver, and mining stocks from the inflation/rate side of the equation.
Technically, the corrective upswing progresses exactly as it was likely to. The markets wanted to rebound based on technical grounds, and they got news that allowed them to do that.
[Section covering gold, silver, and mining stocks is available to Gold Trading Alert subscribers.]
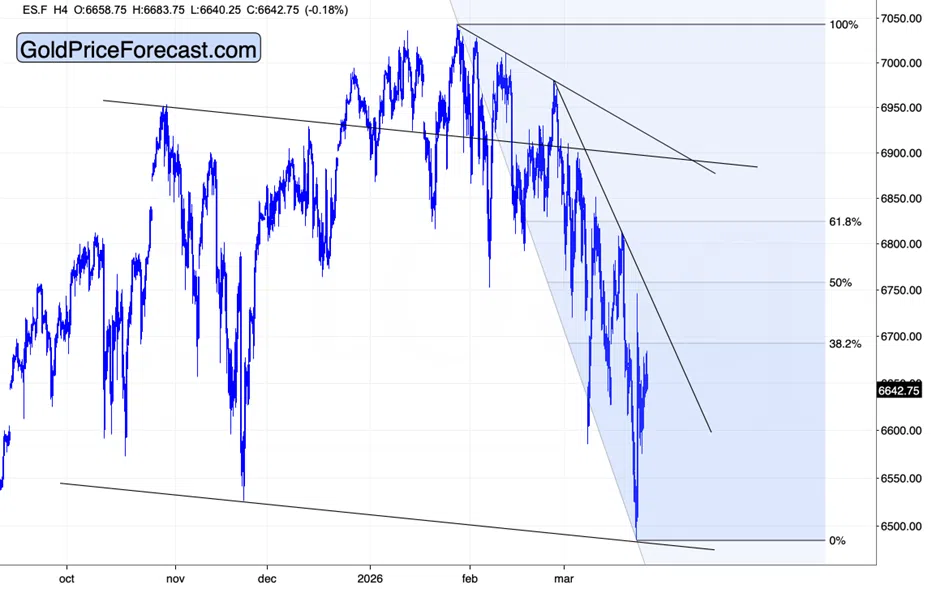
Meantime, stocks and USD are relatively flat today.
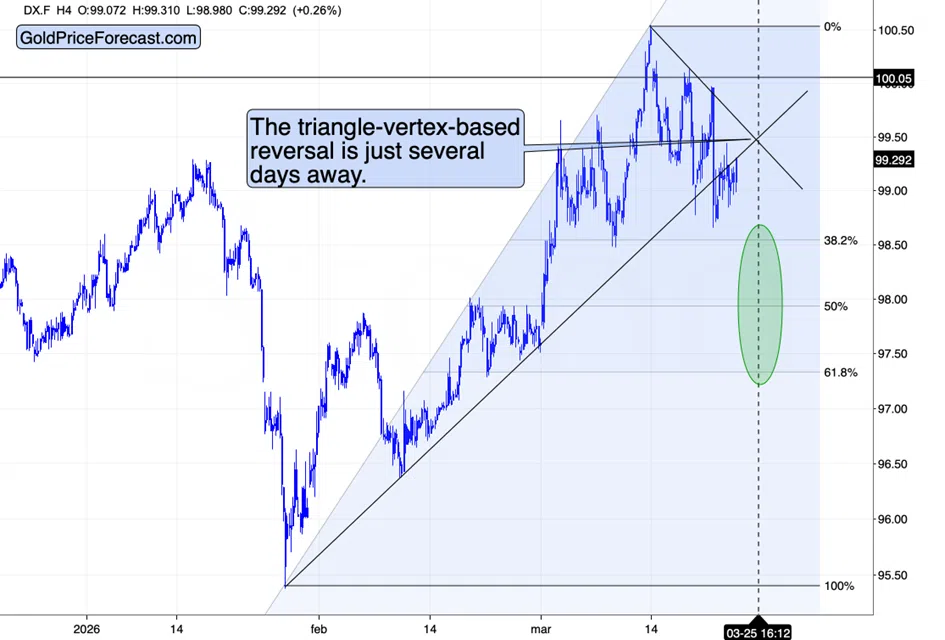
Despite this, the latter chart – featuring the USD Index – provides us with something very important for the immediate-term outlook.
Namely, the USD Index is verifying its short-term breakdown.
This means that it’s likely to move lower once again, and I wouldn’t be surprised to see it fall all the way down to 97.4 before soaring back up – that’s where we have the 61.8% Fibonacci retracement level.
Of course, it doesn’t have to fall as low – it could bottom in the upper part of the buy zone – close to 98.5.
The best thing is that we don’t have to know the exact price, because based on the triangle-vertex-based reversal and the USD’s tendency to reverse close to the turn of the month, we “know” that the bottom is likely to form within the next several days either way.
The opposite is the case for the precious metals market, commodities, and stocks.
Speaking of commodities, please note how well the 61.8% Fibonacci retracement level worked on the crude oil market.
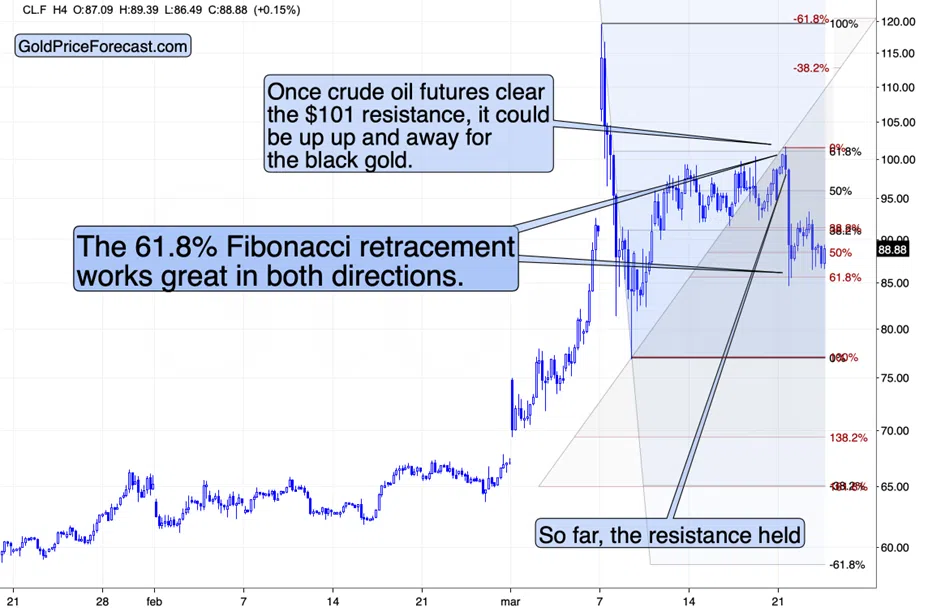
First, this retracement worked as resistance, and now, applied to the recent rally, it worked as support.
Perhaps the bottom in crude oil is already in – but we’ll know more within the next several days. Declining USD could push oil higher, just as it’s likely to push gold and silver higher.
I’m not sure about copper, though, as this market is refusing to move back above its previous 2026 low.
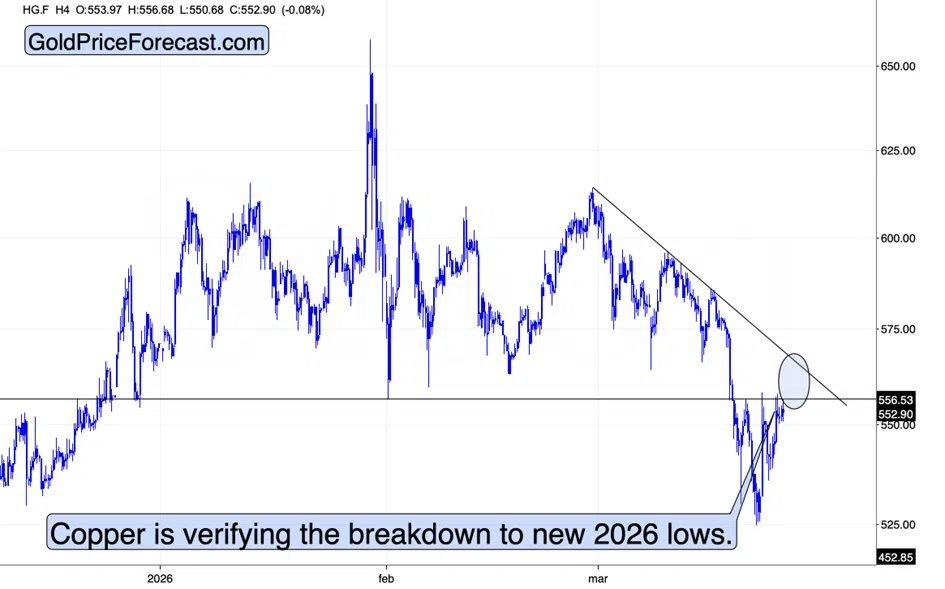
That’s why the lower border of my target area for copper is at the current levels – it could be the case that we won’t see higher copper prices despite declining USD.
Before summarizing, I’d like to quote my previous comments on the chart featuring miners vs. gold:
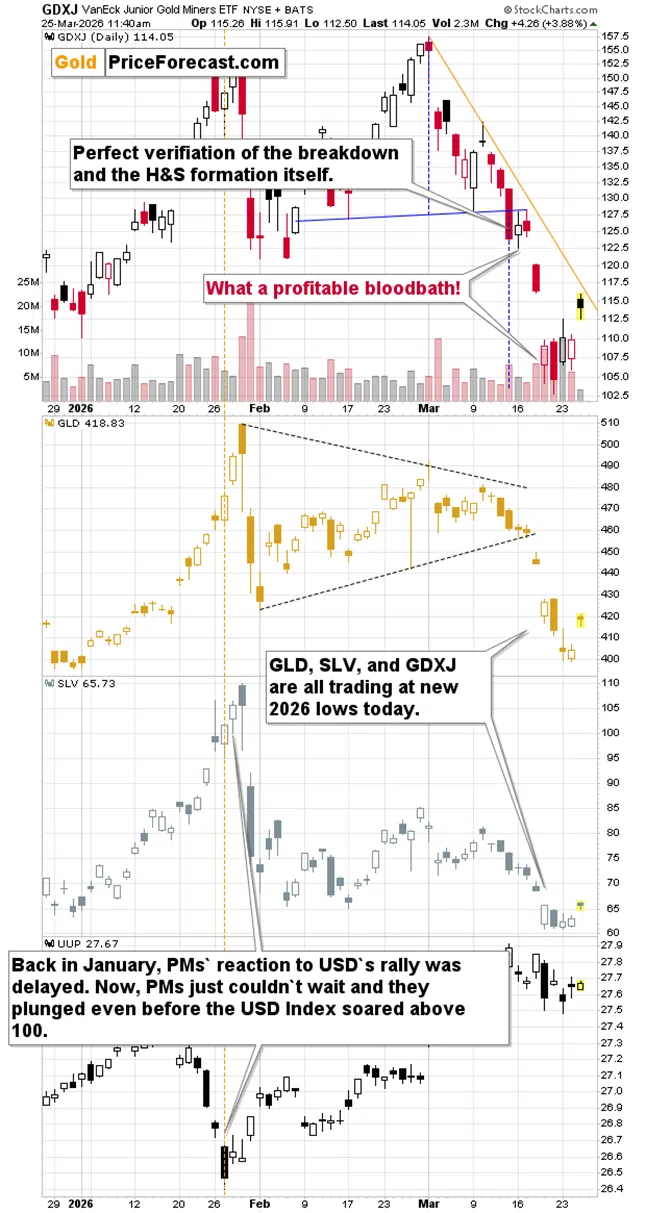
“Please note that the GDXJ didn’t move to new lows even though the GLD ETF did. That’s relative strength in the mining stocks, and that’s a relatively reliable short-term buy signal.”
The prices rallied shortly after I posted the above.
The technicals (Fibonacci retracements, the relative strength analysis, the triangle-vertex-based reversals etc.) work and they will continue to work. Not always, as no tool work perfectly at all times, but please remember this: the technicals are simply too useful to be ignored. At least when applied by people who have experience in that.
Congratulations once again.
As always, I’ll keep my subscribers informed, and I invite you to join them. These are the final days of our extreme promo, and the precious metals market is very close to its next turning point, so the timing seems perfect. Join us today.
Thank you.
Sincerely,
Przemyslaw K. Radomski, CFA