


Some market developments deserve more attention than others and this Friday.
Two markets are giving us particularly interesting reasons to look beyond the latest price fluctuations.
The U.S. dollar has staged an encouraging comeback after defending important support earlier this week. Buyers have already recovered several technical barriers and are now approaching a resistance combination that could determine whether their latest recovery has room to continue.
Copper, meanwhile, is telling a considerably more troubling story.
What began as a loss of important daily support has developed into a warning involving its weekly and monthly technical structures.
And that raises a question with potentially significant consequences: could copper's earlier long-term bullish breakout be in danger?
The answer isn't settled yet, but with Friday bringing both daily and weekly closing decisions, the market is approaching an important technical crossroads.
Are dollar bulls finally ready to break through their overhead resistance? And can copper buyers prevent the latest selling pressure from developing into a more serious long-term problem?
Let's take a closer look.
U.S. Dollar (DX.F) - A Tiny Victory Opens the Door to a Bigger Battle
Sometimes the smallest technical victories produce surprisingly interesting consequences and Thursday gave us a perfect example.
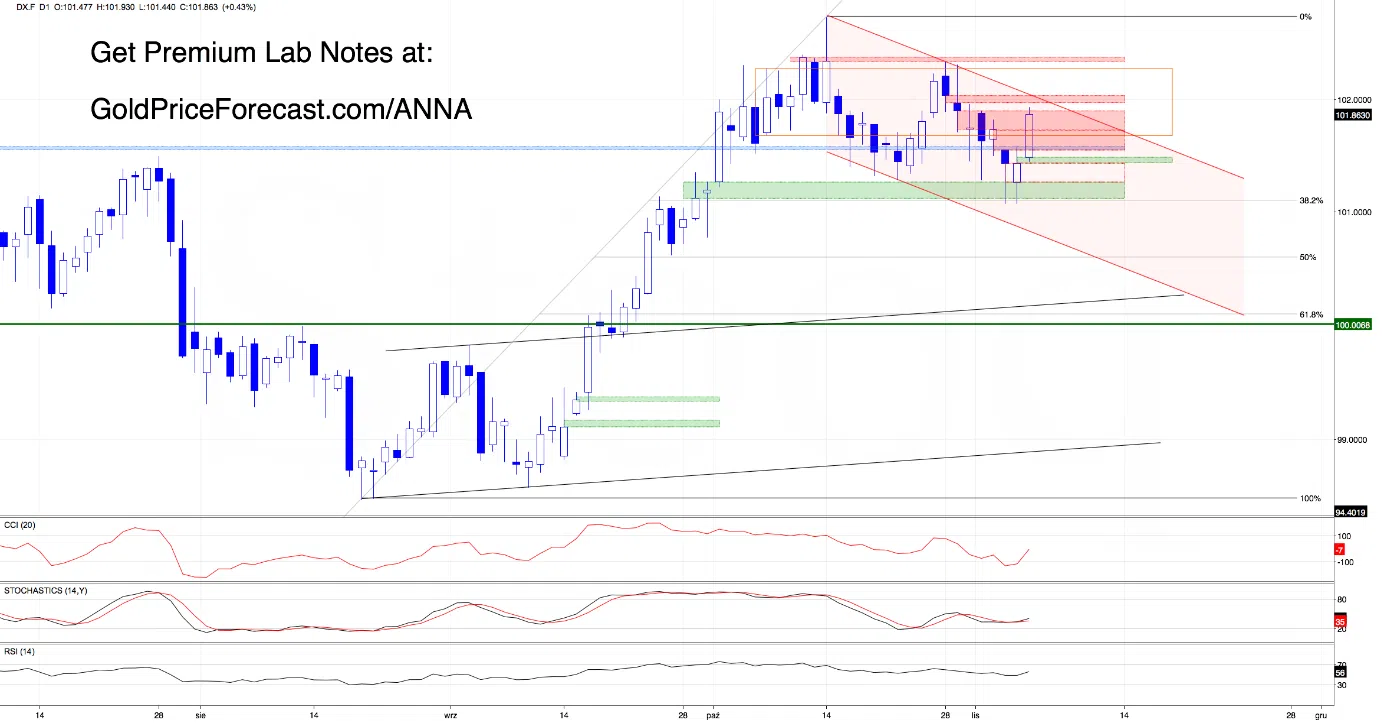
After defending the important support combination near 101.10-101.26, dollar buyers staged another recovery and finished the session just above 101.42, confirming the closure of Thursday's bearish opening gap.
Only a marginal breakthrough?
Certainly, but a confirmed close is still a confirmed close.
And the market responded.
Friday's Asian session opened with a fresh bullish gap at 101.426-101.477, giving buyers another reason to challenge the resistance barriers that had repeatedly stopped their advances.
This time, they made considerably more progress.
The dollar climbed through Wednesday's bearish gap at 101.51-101.72 and even briefly exceeded the upper boundary of the October 30 bearish gap at 101.74-101.89, reaching 101.930.
That's an encouraging development, however, recovering those levels intraday is only the beginning. The older gaps still require closing confirmation, and the bulls are approaching an even more formidable obstacle.
Just above the October 30 gap lies another bearish gap from October 29, reinforced by the upper boundary of the red declining channel. Together, these barriers create a particularly interesting resistance combination and that raises a bigger question.
Are we witnessing another recovery within the declining channel, or are dollar bulls preparing to challenge the bearish structure itself?
A confirmed daily close above the overlapping resistance barriers and the channel's upper boundary would strengthen the bullish scenario considerably. Such a development could reopen the way toward the higher-timeframe resistance combination around 102.33-102.49, which we've discussed repeatedly in previous Premium Lab Notes.
Nevertheless, sellers still have an opportunity to defend their territory.
If the dollar fails to overcome the current resistance area, a corrective pullback toward today’s bullish gap at 101.426-101.477 would become a realistic possibility. A daily close below 101.426 would confirm that gap's closure and weaken the latest recovery, potentially bringing the recent lows and the 101.10-101.26 support combination back into focus.
For now, buyers have clearly demonstrated renewed determination, but the most important resistance is still standing in their way.
Daily Takeaways: Friday's bullish gap at 101.426-101.477 provides the immediate support reference. Watch 101.89 for confirmation of the October 30 gap's closure, followed by the October 29 bearish gap and the red channel's upper boundary. Overcoming that broader resistance combination could revive the bullish scenario toward 102.33-102.49.
Bottom Line: dollar bulls have turned a marginal Thursday victory into an encouraging Friday advance. Now they must prove they can break through the bearish fortress rather than merely approach it.
Copper (HG.F) - The Warning Signs Are Flashing Red
Copper bulls have lost something far more important than another daily support level and to understand why, we need to look beyond the daily chart.
Let's start with Thursday.
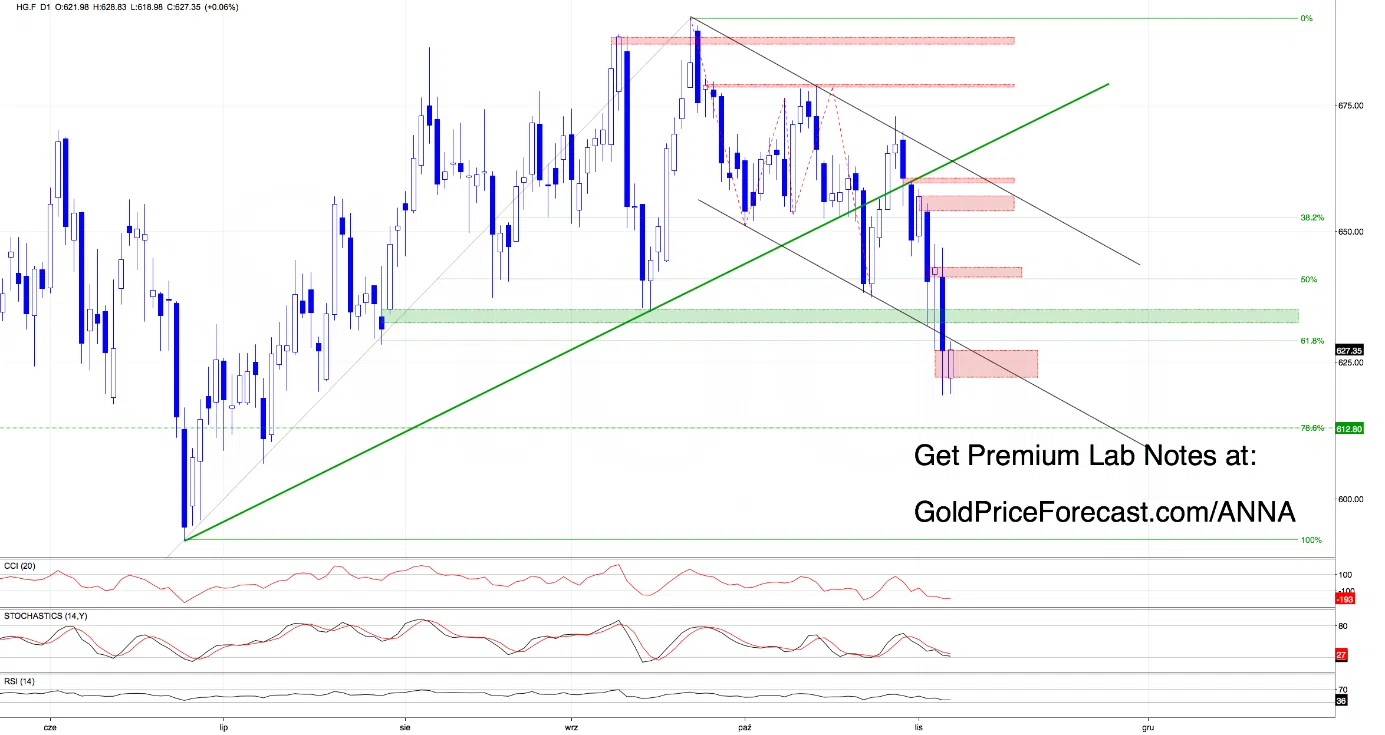
After repeatedly defending the important support combination highlighted in our previous Labs, copper buyers finally lost their footing. The session ended below the daily 61.8% Fibonacci retracement, beneath the lower boundary of the black declining channel, and below the July 30 bullish gap at 631.15-634.95. In other words, the earlier bullish gap was confirmed closed, and the broader daily support combination gave way.
That was already a significant bearish development.
Thursday's decline reached 618.75, penetrating another technical boundary with potentially much greater consequences and we'll return to that in a moment.
Friday's Asian session opened with a fresh bearish gap at 621.98-627, immediately increasing pressure on buyers. Sellers pushed copper down to 618.98, almost exactly matching Thursday's low, and once again, the bulls responded.
The resulting rebound carried prices back toward the upper boundary of Friday's gap, which at least at first glance looks encouraging.
But there's an important complication.
Copper continues to struggle beneath the previously broken daily support barriers, including the 61.8% Fibonacci retracement near 629.12 and the lower boundary of the black declining channel. Unless buyers recover these levels on a daily closing basis, Friday's rebound may turn out to be nothing more than a verification of Thursday's breakdown.
And the problem extends beyond D1.
The Weekly Chart Adds Another Warning
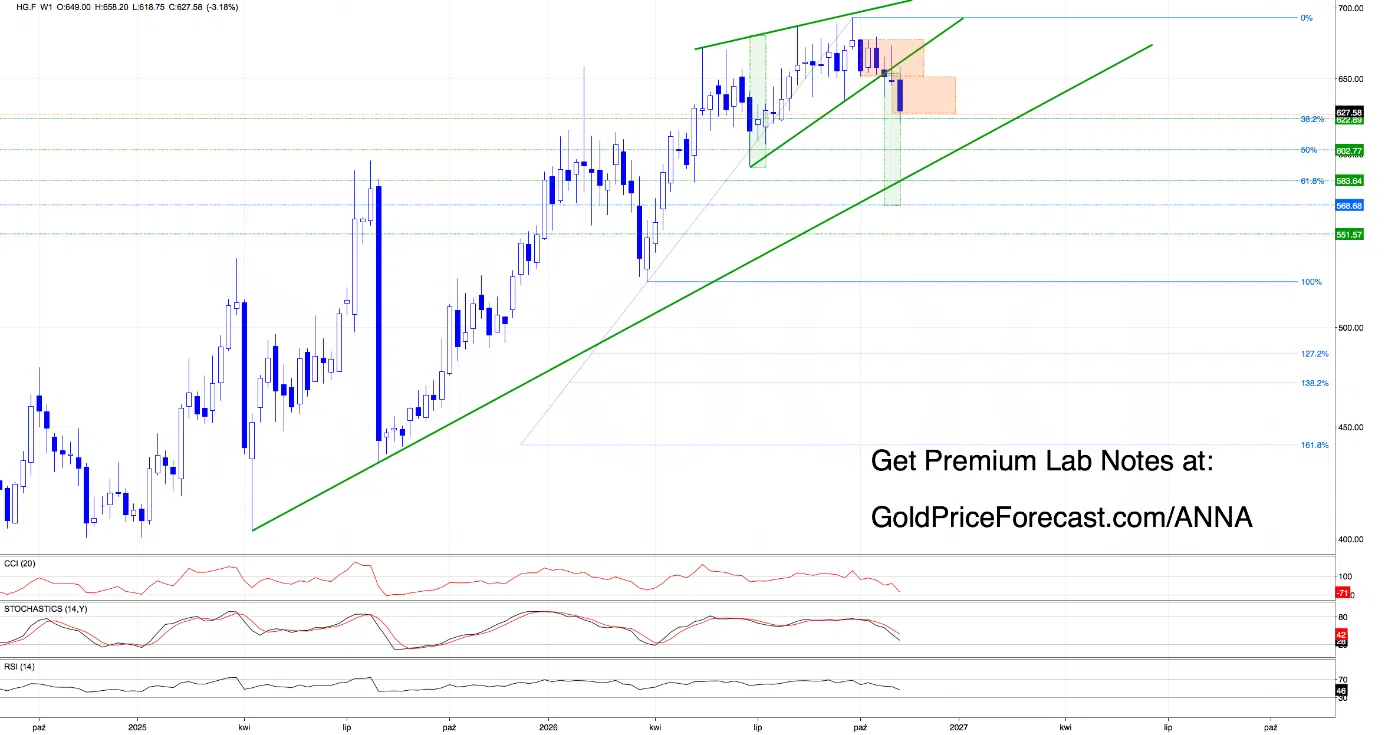
Copper has already broken below the lower boundary of the green rising wedge discussed in our earlier analyses.
Now the market is confronting another important technical test.
The weekly 38.2% Fibonacci retracement near 622.89, calculated from the advance that began in late March 2026 and culminated in late September, has been tested during yesterday’s decline.
Friday's recovery has brought prices back above it (on an intraday basis), which makes the weekly closing price especially important.
A finish above 622.89 would save this Fibonacci level on a weekly closing basis, even though it wouldn't automatically repair the earlier wedge breakdown. However, a weekly close below it would add another bearish confirmation.
Nevertheless, neither result would settle the biggest question facing copper.
For that, we need the monthly chart.
The Monthly Chart - A Much Bigger Risk
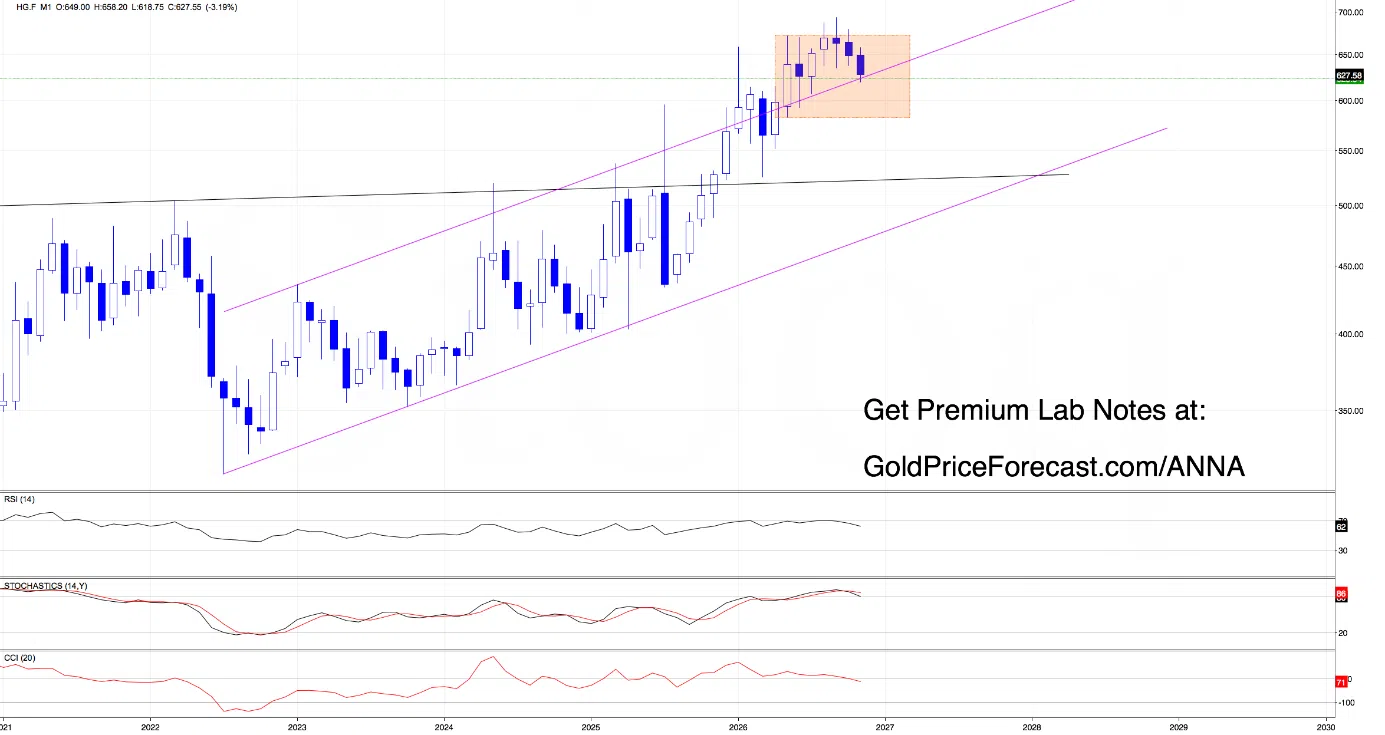
The pink rising channel has been part of copper's long-term bullish structure.
Earlier this year, buyers managed to push prices above its upper boundary, creating an encouraging breakout.
Now that achievement is under serious threat.
Thursday's plunge to 618.75 and Friday's renewed decline to 618.98 have challenged the channel's upper boundary, raising the possibility that the earlier bullish breakout may eventually be invalidated.
And that's a development with consequences far beyond another failed daily support test.
There's one essential distinction, though.
Because this is a monthly structure, the definitive closing confirmation of a failed breakout above the pink channel cannot come before the end of November. The monthly breakdown hasn't been confirmed yet, but the warning signs are already flashing red.
And that leaves us with two very different scenarios.
If buyers manage to close Friday's bearish gap above 627, reclaim the broken daily 61.8% Fibonacci level and the lower line of the black channel, the recovery could gain credibility. That would improve the possibility of another upward move toward the broken lower boundary of the green weekly wedge.
However, if Friday's recovery fails and copper finishes the session below the former daily support combination, today’s upswing would look increasingly like a verification of yesterday’s breakdown. In this case, further weakness beneath the recent lows would intensify the threat to the monthly bullish structure.
And IF the pink channel ultimately be lost (on a monthly closing basis), the resulting bearish implications could be considerably more serious than those of the daily breakdown alone.
This is why Friday's close matters so much.
Not because it will settle every question, but because it may tell us whether the buyers are beginning to repair the damage or whether the danger to copper's larger bullish structure is continuing to grow.
Daily Takeaways: watch 627 for confirmation of Friday's bearish gap closure, followed by the daily 61.8% Fibonacci retracement near 629.12 and the broken black channel boundary. On W1, 622.89 is an important closing reference. Most importantly, the long-term pink rising channel is under threat, although a confirmed monthly invalidation requires the November close.
Bottom Line: Copper's daily breakdown is confirmed, its weekly picture remains damaged, and its monthly bullish breakout is facing a serious threat. The warning is already significant - even though the final long-term verdict hasn't arrived.
What About Gold, Silver, Platinum, and Palladium?
The dollar's recovery and copper's long-term warning aren't the only developments worth examining before the weekend.
Gold is testing whether Wednesday's important bullish breakout can survive renewed selling pressure. A bearish opening gap has already complicated the recovery, but buyers are attempting to defend previously broken resistance that may now provide support.
Silver has encountered an especially frustrating setback. After narrowly missing confirmation of an important bullish breakthrough on Thursday, buyers are now facing two overlapping bearish gaps. Their ability to overcome this resistance could help determine the direction of the next move.
Platinum is approaching the end of the week beneath an important historical resistance level. Friday's quieter trading may represent consolidation after the recent bullish rebound, but sellers still have an opportunity to challenge that interpretation.
And palladium has delivered an interesting continuation of yesterday's scenario. Buyers successfully recovered a declining channel boundary, but bearish gaps overhead have triggered a corrective response. The latest price action is testing whether that recently reclaimed support can withstand renewed pressure.
Four markets, four different technical battles and several closing prices that could shape the beginning of next week.
In today's complete Anna's Trading Lab Premium, we examine these developments in detail, connect them with our previous scenarios, and identify the support and resistance levels that matter most. The Premium edition also includes our Friday's Cheat Sheet, bringing together the key technical levels and scenarios for all six markets in one convenient summary.
If you'd like to follow the complete analysis and see how these market scenarios develop, I invite you to start your premium free trial today. And if you're not yet receiving our free gold market updates, you're welcome to join our free gold mailing list, too.
Final Thought - Sometimes the Warning Comes First
Not every important market signal arrives as a confirmed breakout or breakdown.
Sometimes the first indication of trouble is a failed attempt to recover support. Sometimes it's an unusually strong reaction around a historical resistance level. And… sometimes the most revealing warning appears only when we compare the daily chart with the much bigger picture.
That's what makes the current situation so fascinating.
The dollar is showing renewed strength, while copper is confronting a threat to a structure that has supported its larger bullish story.
Neither market has answered every question yet, but both have given us something important to watch.
Good technical analysis isn't about declaring victory before the battle ends. It's about recognizing when the evidence begins to change.
Have a wonderful weekend, stay curious, and let the closing prices tell their story.
Anna