Oil is hitting multi-year support just as sellers are losing steam. Is a major reversal brewing?
I like to unlock one of our previous Premium Lab Notes for the entire community (today's report was originally published for Premium readers on Friday).
Why share it today?
Because the key technical levels and market structure remain in play.
Sometimes, the biggest advantage isn't finding new levels every day but… recognizing that the important ones don't expire overnight and often stay relevant much longer.
Enjoy the read... and pay close attention to how the market behaves around those areas.
Market Context
Crude oil remains under heavy pressure after another week dominated by aggressive selling. Both WTI and Brent have already reached major support zones, while fresh bearish gaps continue reminding traders that sellers are still in control - for now.
At the same time, the first bullish divergences are beginning to appear on daily charts. That doesn't mean the downtrend is over, but it does suggest momentum is fading. The next few daily closes could determine whether oil is preparing for a meaningful reversal or simply pausing before another leg lower.
Crude Oil WTI (CL.F)
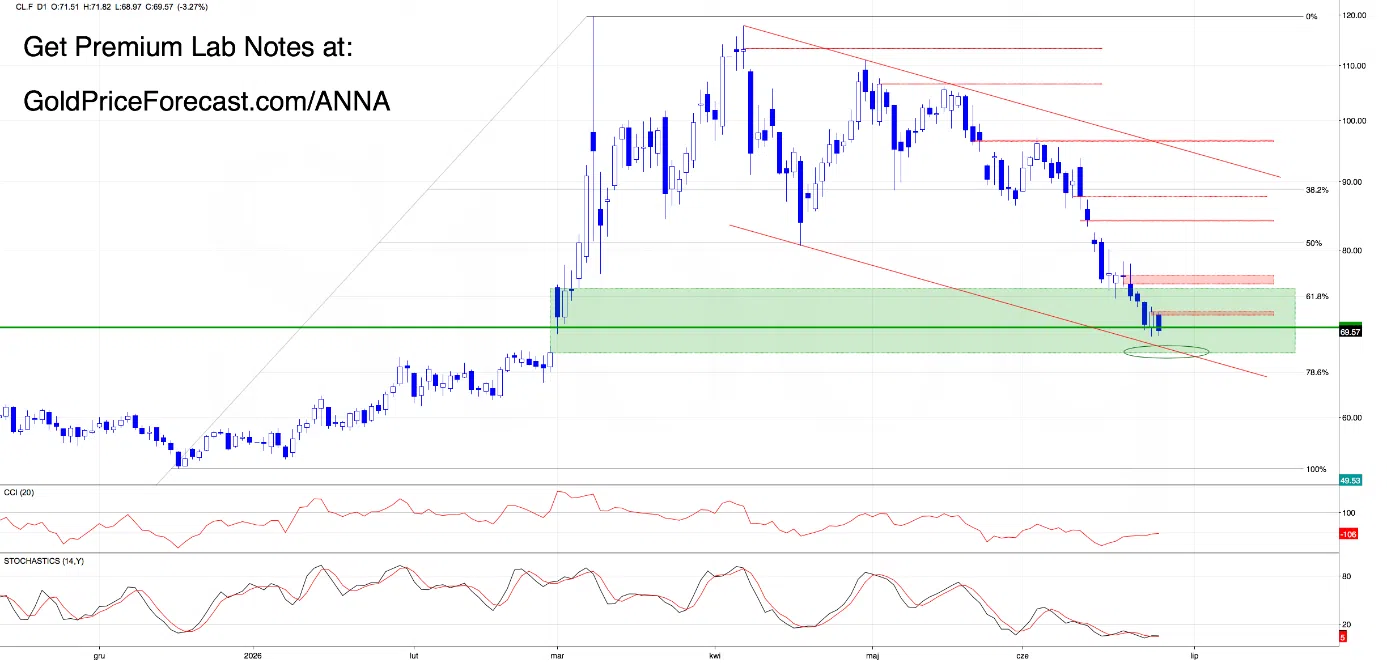
Let's begin with a quick reminder of what we discussed in our previous report:
“(…) Price is still trading below 80, the April's low, and under two major bearish gap zones.
That's why, in our view, until we see at least an invalidation of the earlier breakdown below 80 and April's low, every rally should be treated as a potential verification of the previous breakdown.
Adding to that, daily indicators still haven't generated buy signals, which means bulls aren't getting much technical support yet.
Therefore, in our opinion, another downswing toward the 74 area (61.8% Fibonacci retracement) is likely. (…)”
Looking at today's chart, it's clear that bears wasted no time putting that bearish roadmap into action. Within just one session, price reached the 61.8% Fibonacci retracement, confirming that sellers were still firmly in control.
Even though buyers managed a modest bounce late last week, they couldn't even get close to reclaiming the previously broken 80 resistance level.
The result?
This week opened with another bearish gap (75.40-76.51), triggering wave of selling and pushing WTI slightly below the psychologically important 70 level.
Yesterday’s session offered only a brief bounce before another bearish gap (71.51-71.92), which appeared at the beginning of today’s Asian session, giving sellers yet another reason to stay aggressive.
At this point, crude oil has slipped back below 70, increasing the probability that bears will eventually challenge the next major support cluster, built around the lower boundary of the large March gap (67.02-75) and the lower boundary of the red declining channel.
Before jumping to bearish conclusions, though, there's something worth paying attention to.
Daily momentum indicators are beginning to display bullish divergences.
What does that actually mean?
Simply put, price is still making fresh lows, but momentum is no longer following along. In other words, sellers continue pushing the market lower, but they're doing it with less and less strength. Divergences don't predict reversals by themselves, but they often serve as the market's first warning that a trend may be running out of fuel.
Now it's time to connect the dots.
Is a reversal around 67 starting to become a realistic possibility?
Maybe, but price still needs to prove it.
The first encouraging signal would be a daily close above 71.92, which would also mark the first successful close above a bearish gap in weeks.
What could happen if bulls fail around 67?
In this case, test of the 78.6% Fibonacci retracement (around 67) should not surprise us.
Crude Oil Brent (CB.F)
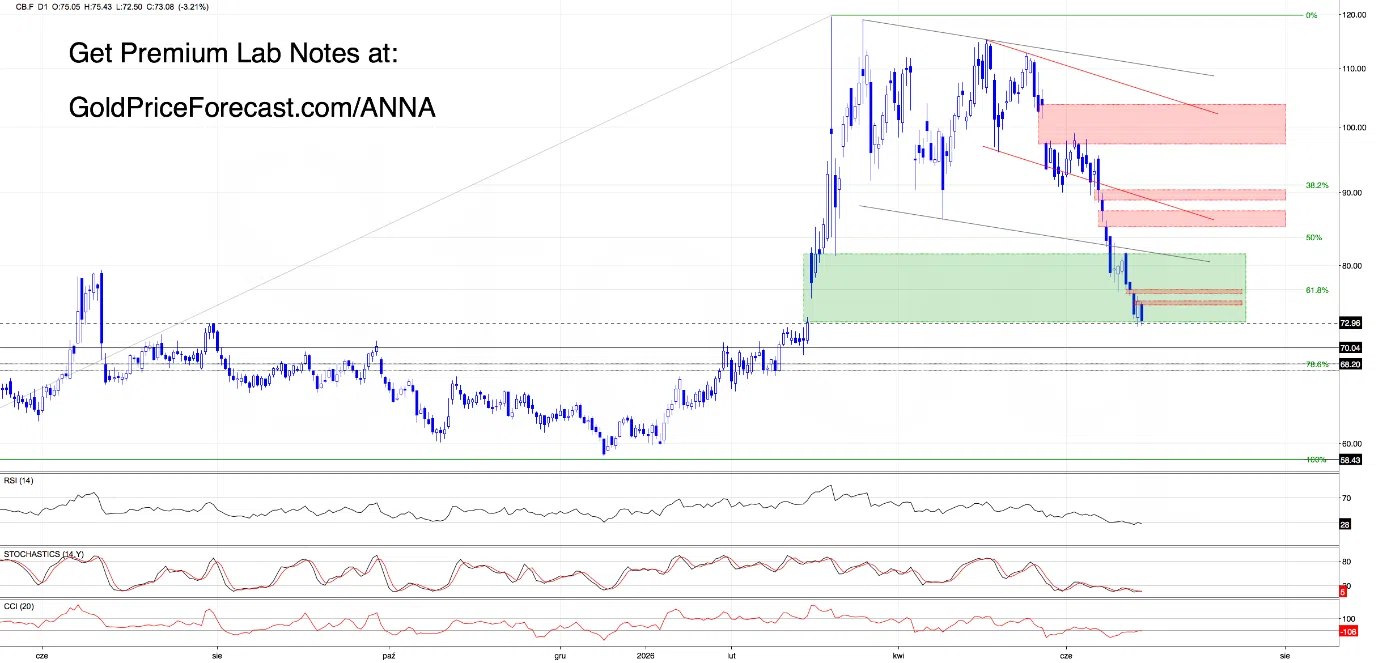
Before diving in, let’s revisit the quote from June 17:
“(…) One more thing worth remembering…
Friday's close below the lower border of the red declining channel activated a bearish scenario with a minimum downside target around 76, just below the 61.8% Fibonacci retracement of the entire bull market that started last year.
Therefore, in our opinion, another downswing toward that target remains a realistic possibility in the coming sessions - especially since daily indicators still haven't generated any meaningful buy signals. (…)”
Brent followed our bearish roadmap almost perfectly. Not only did sellers reach our downside target, but they also managed to push price even lower.
The warning signs actually appeared earlier.
Despite last week's rebound, buyers failed to reclaim the previously broken lower boundary of the black descending channel.
That weakness was followed by a classic bearish engulfing pattern at the beginning of this week, giving sellers fresh momentum and confirming that the path of least resistance remained lower.
Wednesday added even more fuel to the bearish story.
A fresh bearish gap between 76.38-76.80 attracted another wave of selling, ultimately completing the downside scenario we outlined earlier this week (congratulations to everyone who trusted the setup and locked in profits!).
Now Brent has reached one of the most important technical areas on the entire chart.
Price is testing the lower boundary of the large bullish gap from March (72.87-81.57) while also sitting near the previously broken late-July 2025 highs.
Once again, daily indicators are beginning to flash bullish divergences, suggesting downside momentum is gradually weakening.
But traders shouldn't get ahead of themselves.
If bears manage to finish today's session - and this week's candle - below this support zone, the next downside targets around 70 or even 67.50-68.20 could quickly come into focus.
So, what would be the first sign that buyers are finally fighting back?
A daily close above 76.80 (successfully filling this week's bearish gaps), which would be the first meaningful technical victory for the bulls.
Today’s Takeaway
For WTI:
- Watch 67.02-70.00 support zone
- Daily close above 71.92 -> first bullish confirmation, which could open room for a bigger recovery
- Daily close below 67.02 -> increases odds of a move toward 65
- Bullish divergences are appearing, but confirmation is still required
For Brent:
- Watch 72.87 key support
- Daily close above 76.80 -> first bullish confirmation, which could open room for a bigger recovery
- Daily close below 72.87 -> increases downside risk toward 70.00 or even 67.50-68.20
- Bullish divergences suggest sellers are losing momentum, but price still needs to confirm the reversal
Final Thought
Strong trends rarely end because the price simply stops falling. They usually end because momentum fades first, and that's exactly what we're beginning to see in crude oil.
Bullish divergences don't tell us that a reversal has already begun, but they do tell us it's time to stop blindly chasing the trend. The next opportunity won't belong to the fastest trader. It will belong to the most patient one who waits for the price to confirm what momentum is already whispering.
Stay disciplined, stay selective, and wait for clean setups.
Anna