Oil is approaching one of those moments where the next big move may be decided.
After last week’s rebound, both WTI and Brent are now caught between powerful support and resistance zones. Buyers have managed to stabilize prices, but they still haven’t delivered the kind of breakout that would confirm a new bullish leg. At the same time, several short-term technical signals suggest that sellers are beginning to push back. And… when price is trapped inside a range, the highest-probability opportunities usually appear only after the market clearly chooses a direction.
Crude Oil (WTI)
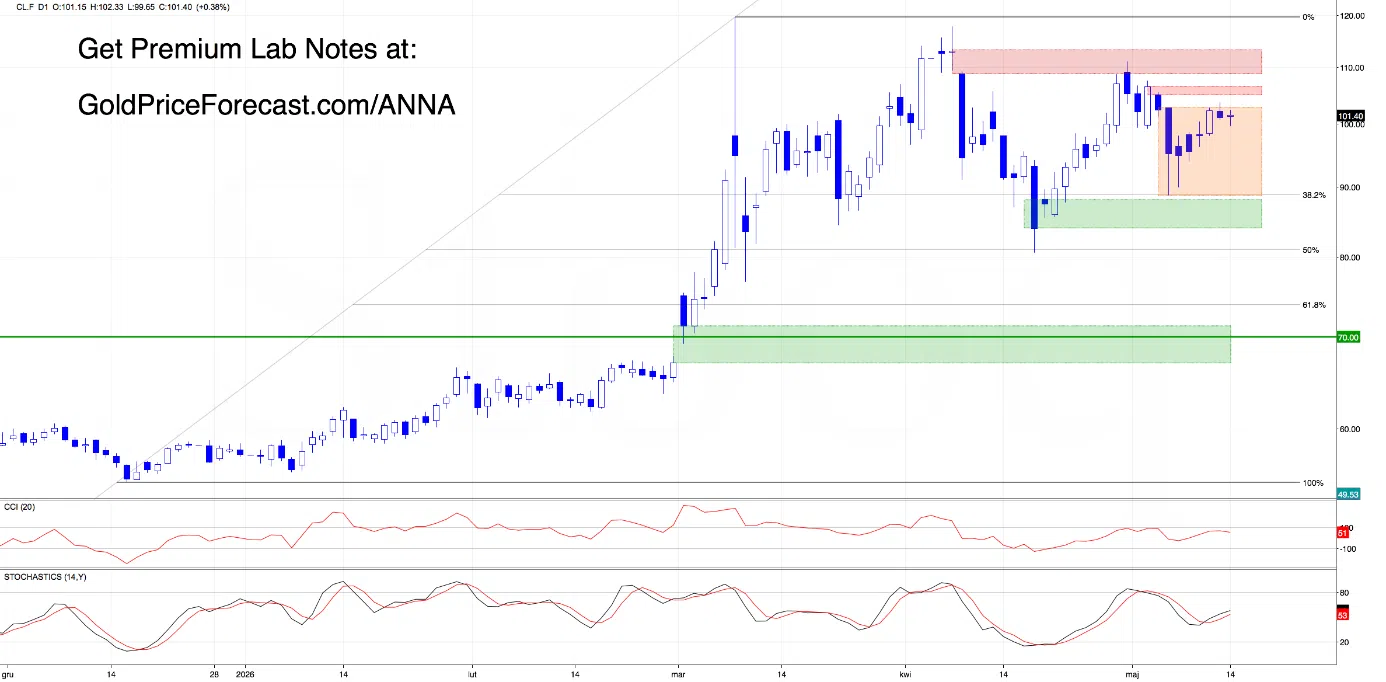
Looking at the daily chart, one thing becomes clear right away: despite the rebound we’ve seen over the past week, the bigger technical picture hasn’t changed all that much.
WTI is still trapped inside a broad orange consolidation between 88.66 and 102.70, sitting just below the May 5 bearish gap at 104.93-106.42.
Yes, buyers did make a run at the upper boundary of that range yesterday, but when they reached the ceiling, they ran out of fuel. Instead of breaking out, the price slipped back into the consolidation and closed inside the range.
In other words, the earlier breakout attempt failed. That invalidation triggered a pullback and brought crude oil back to test the psychologically important $100 level during today’s session.
So, what happens next?
The simplest answer is this: until we see a daily close above 102.70 or below 88.66, oil remains stuck in a technical cage. And when a market is trapped in a range, patience usually pays better than prediction.
What Does the 4-Hour Chart Reveal?
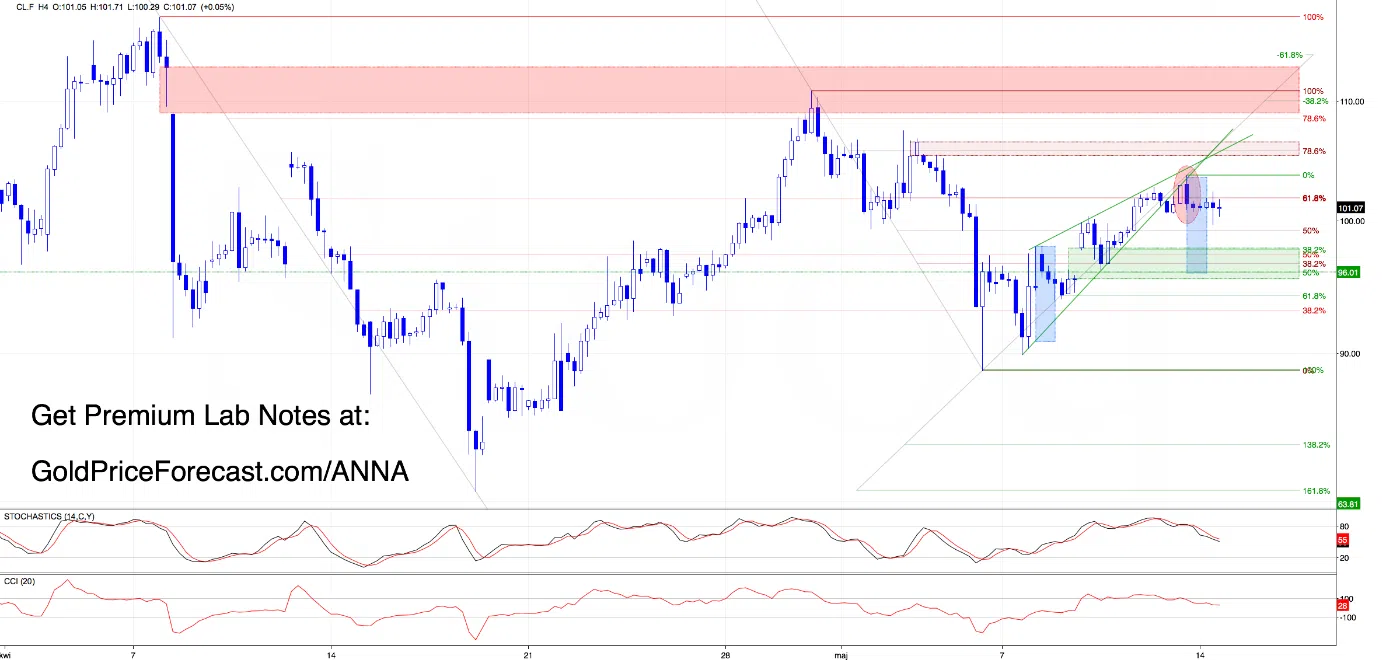
The 4H chart adds several important clues.
First, the entire rally from the beginning of the month fits neatly inside a green rising wedge. And yesterday brought a major technical event: a successful verification of the earlier breakdown below the lower boundary of that wedge, which significantly increases the odds that the downside move may continue.
Second, yesterday’s failed rally left behind a bearish engulfing pattern, which now strengthens the nearest resistance zone.
Third, the decline invalidated the earlier breakout above the 61.8% Fibonacci retracement, giving sellers yet another technical advantage.
Fourth, both CCI and Stochastics generated fresh sell signals, effectively giving bears the green light to press their attack.
And fifth, buyers attempted today to reclaim the broken Fibonacci level but failed (that failure adds even more weight to the bearish case).
The Bearish Scenario
Based on the rising wedge pattern, the minimum downside target points toward the $96 area over the coming days, especially if WTI closes the day below the $100 level.
And that target is no random number.
It sits inside a very important support zone built around:
- the May 11 bullish gap (95.42-97.85),
- the 50% Fibonacci retracement of the entire rally that began on May 6, and
- the May 11 low.
As the chart clearly shows, the bullish gap successfully stopped the previous selloff. Therefore, when we take this fact into account and combine it with the above-mentioned additional support levels, we see that this area creates a highly significant battlefield that could determine the next larger move.
What Would Invalidate the Bearish Setup?
The first meaningful signal that would weaken the bearish scenario would be a daily close above 103.66.
Why?
Such a move would neutralize yesterday’s bearish engulfing pattern and suggest that buyers are regaining control.
Nevertheless, even then, bulls would still face several major obstacles overhead:
- the May 5 bearish gap at 104.94-106.42,
- and the much larger April 8 bearish gap at 108.74-112.95.
That second gap stopped the rally during the final trading days of April and remains the primary barrier standing between oil and a potential move toward $120.
Adding to the challenge, both gaps are reinforced by the upper boundary of the green wedge visible on the 4H chart.
In other words, bulls still have a lot of work to do if they want to push oil meaningfully higher.
Brent Crude Oil (CB.F)
The technical picture in Brent is even more intriguing and a bit more complex.
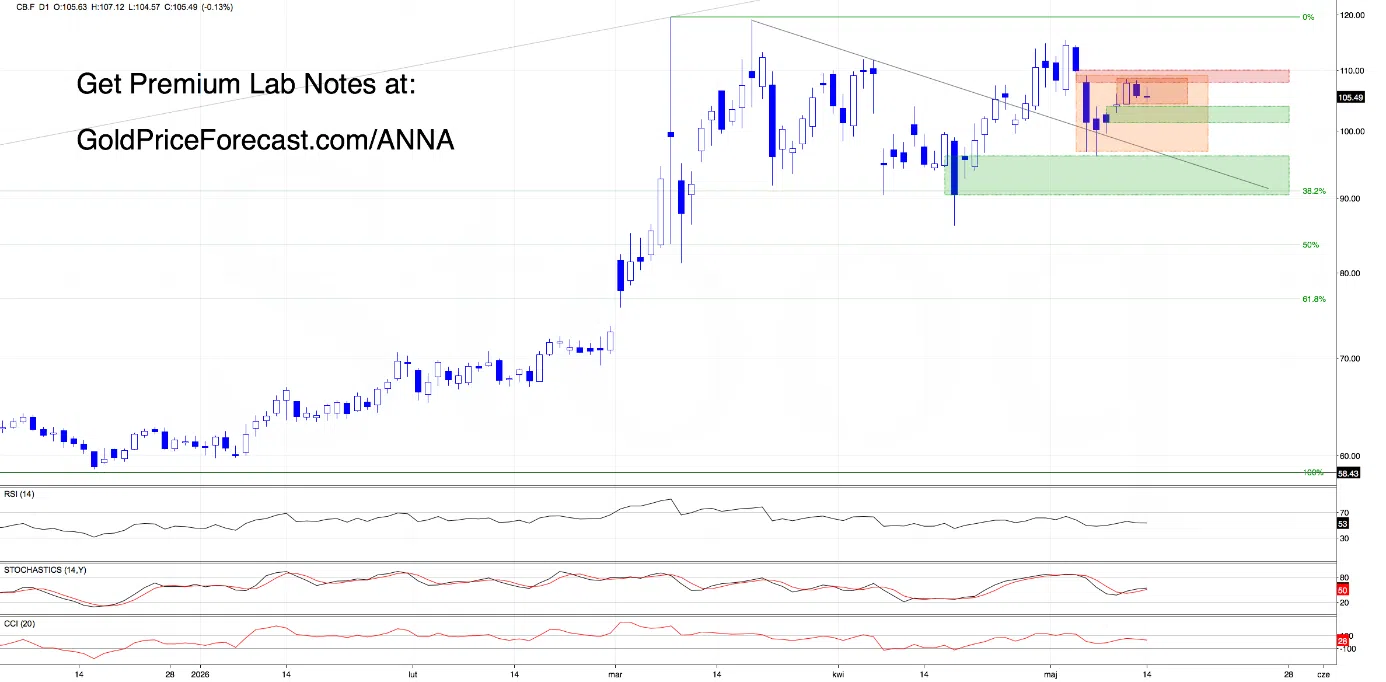
On the daily chart, Brent is trapped inside:
- a broad orange consolidation between 96.75 and 109.02,
- and a smaller short-term consolidation between 104.23 and 108.45.
This narrower range sits between two important price gaps:
- the May 6 bearish gap at 107.92-109.87,
- and the May 11 bullish gap at 101.29-104.00.
That creates a classic technical stalemate. Therefore, as long as neither gap is decisively closed, sideways trading remains the most likely scenario.
Brent on the 4-Hour Chart
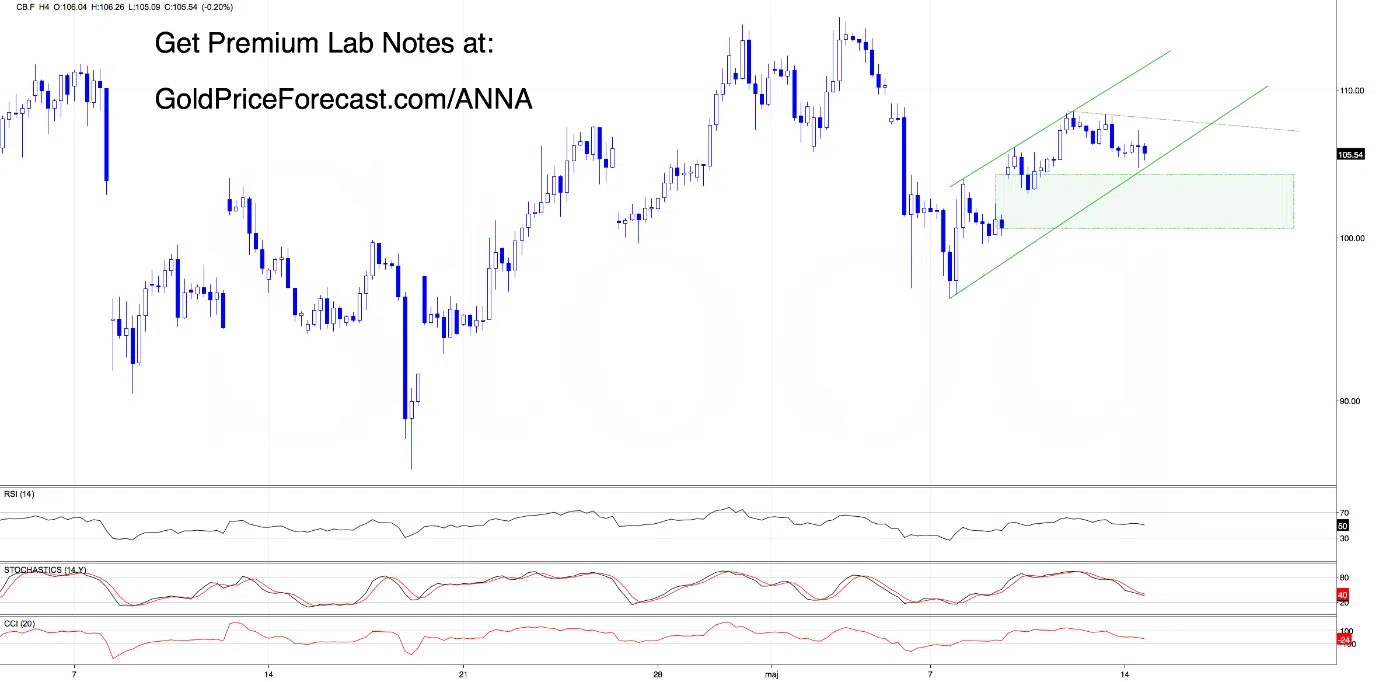
The 4H chart tells a story very similar to WTI.
Brent has also broken below a green rising wedge and successfully verified that breakdown during today’s European session. That move led directly to a test of the nearest very short-term support zone: the May 11 bullish gap.
Momentum indicators continue to favor sellers. However, as long as that bullish gap remains open, buyers still have an important ally preventing a deeper decline.
At the same time, every bounce should be viewed with caution.
Therefore, until Brent climbs back above the previously broken lower boundary of the wedge, any rally is best interpreted as a retest of the breakdown rather than a confirmed reversal.
That leaves the market trapped in a relatively tight range. And, as noted earlier, only a daily close above 109.87 or below 101.29 is likely to break the deadlock and provide meaningful clues about the direction of the next larger move.
For now, these are the two levels that deserve your full attention.
Today’s Takeaway & Key Levels to Watch
For WTI Crude Oil
- watch the $100 level closely because it is the nearest psychological support and an important short-term battleground
- daily close below $100 -> increases the probability of a decline toward the $95.42-97.85 support zone and potentially the $96 area
- daily close above $103.66 -> neutralizes the bearish engulfing pattern and weakens the immediate bearish scenario
- breakout above $104.94-106.42 -> closes the May 5 bearish gap and opens the door to a larger recovery
- as long as price remains between $100 and $103.66, expect continued back-and-forth price action
- if you’re already short: the $96 support zone is the first major target area to watch.
- if you’re looking to enter: let the daily close confirm the next move before committing capital.
For Brent Crude Oil
- watch the 101.29-104.00 bullish gap because it remains the key short-term support zone
- daily close below 101.29 -> confirms a bearish breakdown and opens the door to lower levels
- daily close above 107.92-109.87 -> closes the May 6 bearish gap and significantly improves the bullish outlook
- as long as price remains between 101.29 and 109.87, the market is effectively trapped in a technical stalemate
- if you’re already in a position: today’s close could provide an important clue about momentum heading into the next few sessions.
- if you’re waiting for a setup: patience is likely to be rewarded more than trying to predict the breakout direction.
Quick heads-up: if you’re watching the U.S. dollar, gold and silver I broke them down in detail, including the levels that could define the next move and scenarios in today’s analysis for my Premium readers. If you don’t want to miss it while it’s being built - not after it’s already happened - you can test Premium Lab Notes for 7 days for free here:
👉 Premium Access: Anna’s Trading Lab
Stay calm, trust the process, and let the levels do the work.
Anna