While copper flirted with resistance and gold staged a triangle defense, EURUSD came through as the silent killer.
Yesterday’s move set up a fresh bullish structure right before the market close. The next levels are already in sight, and the playbook remains wide open for bulls.
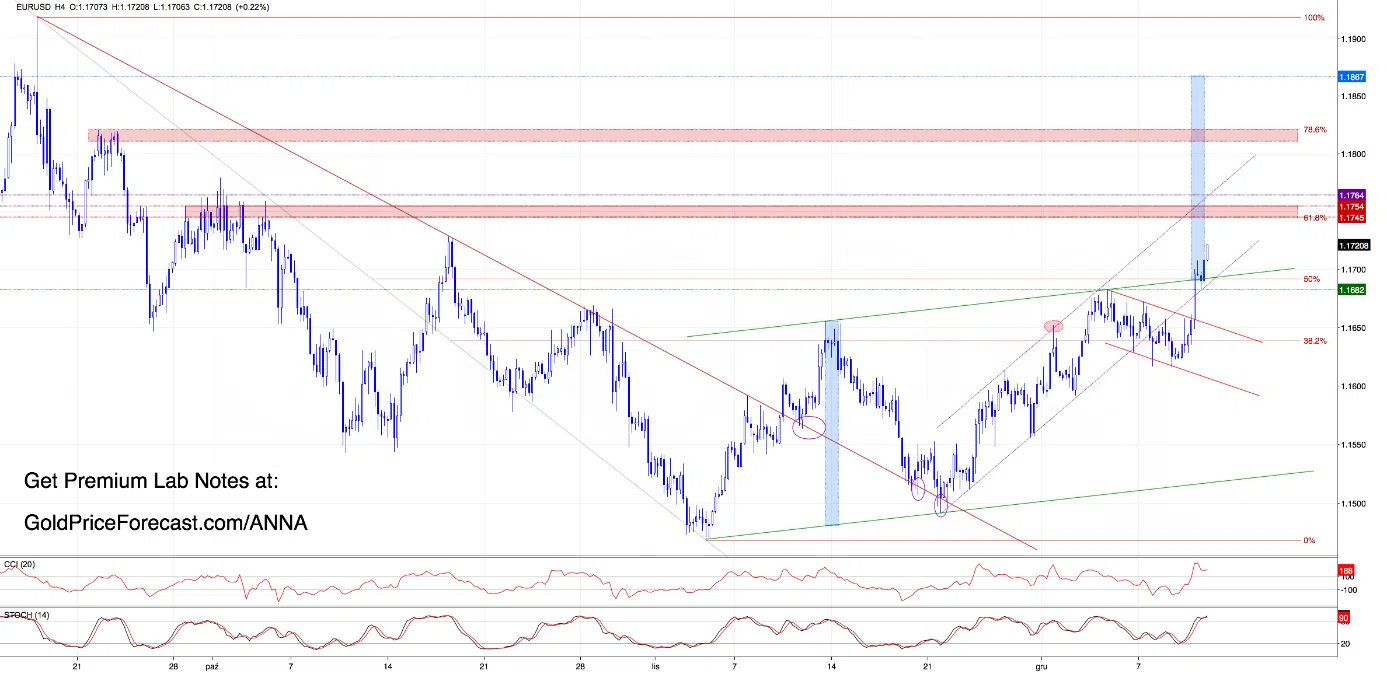
H4 Outlook
Let’s rewind to what we wrote in Lab Note #27:
(…) Bearish Scenario:
Technical indicators aren’t exactly flashing green and CCI and Stochastics are deep in overbought territory. Additionally, a negative divergence on Stochastic suggests momentum may be fading even as price climbs.
If price is rejected from current resistance, look for a move back to 1.1650 zone (which serves now as a support).
A failure to hold that support could bring (…) the lower edge of the purple channel back into play.
From today’s point of view, we see that the situation developed in tune with the above scenario and price dropped the very next day (not only validated our bearish setup but also handed profits to those in position), tagging the lower edge of the purple rising channel.
If you were on that trade - congrats!
The scenario played out with textbook precision, and some of you caught it beautifully.
The purple channel held, and EURUSD bounced sharply… but bulls couldn’t reclaim the local highs. That hesitation brought sellers back into the game and a temporary breakdown occurred.
But here's where it gets interesting… sellers failed to push lower. The red declining channel stepped in as support, stalling the drop. Additionally, indicators flashed early buy signals, which translated into a quick reversal and a breakout from both the red channel AND the green rising channel right before yesterday’s U.S. close.
Asia confirmed the breakout, giving bulls room to breathe.
Targets in Play
As long as this move holds, these are the zones we’re watching:
- 1.1745-1.1754: key resistance (61.8% Fibonacci retracement + late October highs)
- 1.1764: upper edge of the purple rising channel
- 1.1785-1.1820: red resistance zone + 78.6% Fibonacci retracement + Oct. 23&24 tops
- 1.1867: textbook channel breakout projection (measured move)
Indicators Check
Yes, both H4 and Daily are technically overbought. But until we see real sell signals?
The road to at least the first target remains open.
See you on the next chart.
Anna
Trading Lab Founder