In today’s globalized economy and interconnected financial markets, no market can truly move on its own.
Commodities, stocks, and precious metals are connected, too.
Consequently, what happens in commodities like copper and in stocks (e.g. Toronto Stock Exchange Venture Index) has important implications on gold’s really big picture.
Let’s start today’s technical discussion with a quick check of copper prices.

Copper rallied recently, but it stopped at its 61.8% Fibonacci retracement level and then moved back down. Consequently, the recent move – while impressive from the day-to-day point of view – remains to be a short-term correction only.
Consequently, what I wrote about it previously remains up-to-date:
Copper recently CLEARLY invalidated another attempt to move above its 2011 high. This is a very strong technical sign that copper (one of the most popular commodities) is heading lower in the medium term.
No market moves up or down in a straight line (well, the 2008 slide appears to have been an exception), and a short-term correction doesn’t necessarily invalidate the bigger trend. For the last couple of months, copper has been trading sideways, but it didn’t change much regarding the outlook.
In fact, it made my previous target area even more likely. You see, the consolidation patterns are often followed by a move that’s similar to the move that preceded them. In this case, the previous 2022 decline was quite significant, and if it is repeated, one can expect copper to decline well below 3.
Actually, copper could decline profoundly and bottom in the $2.0-2.7 area. That’s where we have rising, long-term support lines and also the previous – 2016 and 2020 – lows.
Flag patterns (which we just saw in copper) tend to be followed by price moves that are similar to ones that preceded them. I marked this on the above chart with red, dashed lines. This method supports a copper price’s move to around $2.7.
Given the size of the previous decline (and its pace), it seems quite likely that it could take another 2-7 months for copper to move to about $2.4. May seems to be the most likely time target given the current data.
Interest rates are going up, just like they did before the 2008 slide. What did copper do before the 2008 slide? It failed to break above the previous (2006) high, and it was the failure of the second attempt to break higher that triggered the powerful decline. What happened then? Gold declined, but silver and mining stocks truly plunged.
Again, copper is after invalidation of a major breakout, a decline, and a correction. Copper prices currently SCREAM that it’s a variation of 2008 all over again. This is extremely bearish for mining stocks (especially juniors) and silver.
Before moving further, I’d like to extend the copper analysis into the analysis of the situation in one of the major copper companies – FCX. That’s where there’s the “extra trading opportunity” that I described in early April.
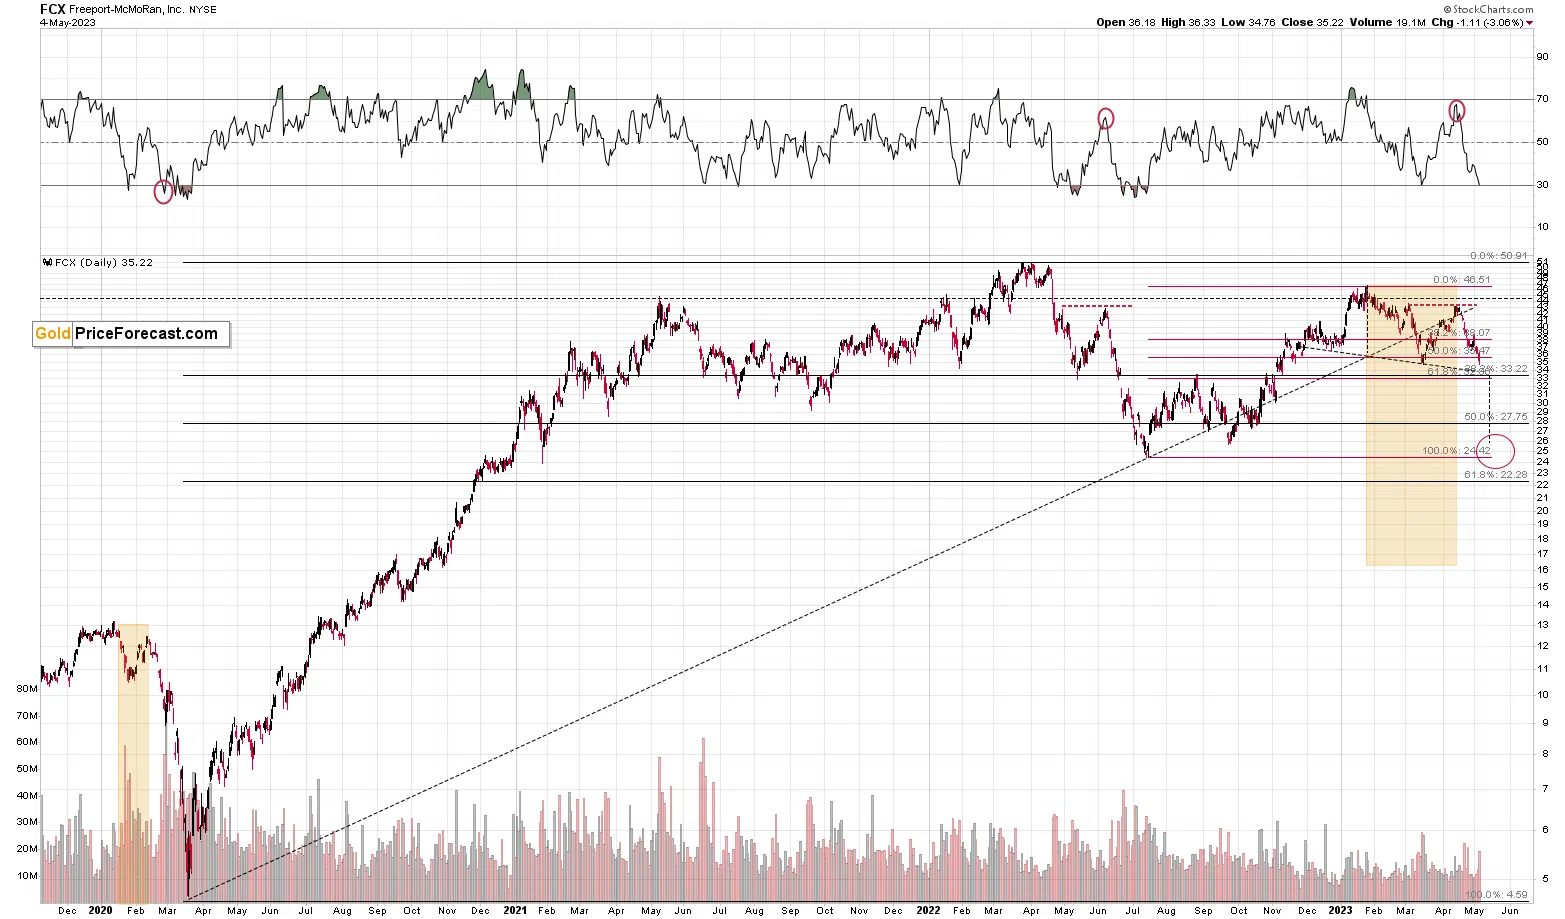
The FCX moved back above its rising support line, and it invalidated this move and then in plunged.
The decisive move lower, despite the lack thereof (the decline is just “normal” for now) in the S&P 500 shows weakness in the FCX and indicates further declines ahead.
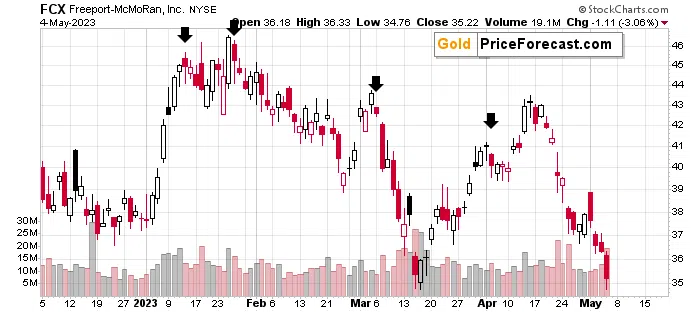
Technically, the recent situation seems similar to what we saw in June, 2022. Back then the FCX topped with RSI at similar levels and with price itself close to its recent high.
Also, since FCX’s performance is connected to the one of the stock market, you’ll see more bearish indications in the following part of the analysis.
Long story short – the big profits on the FCX are likely to become even bigger in the future.
Having said that, let’s check the junior miners’ really big picture.
In short, we saw a tiny correction in the TSX Venture index, and this should be a major red flag for anyone thinking that the recent rally was a game- or trend-changer. This is a blip on the radar screen, similar to what we saw in the second half of 2021, before another big move lower.
The really important thing here is that we saw the first crack in the dam. The index declined visibly, and it might mean that the final part of the 2008-style slide has just begun.
Consequently, my previous comments on the above chart remain up-to-date:
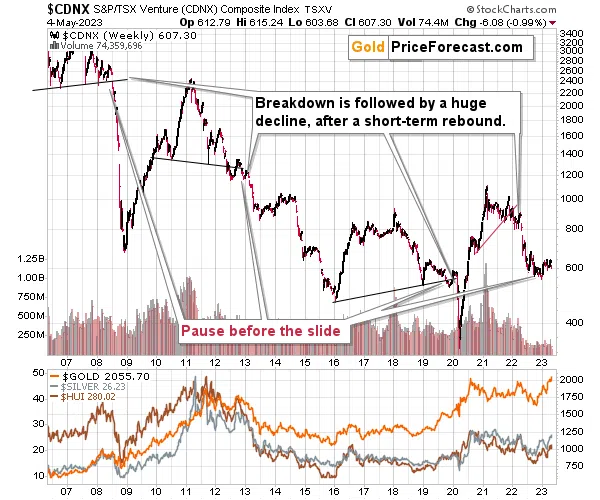
The Toronto Stock Exchange Venture Index includes multiple junior mining stocks. It also includes other companies, but juniors are a large part of it, and they truly plunged in 2008.
In fact, they plunged in a major way after breaking below their medium-term support lines and after an initial corrective upswing. Guess what – this index is after a major medium-term breakdown and a short-term corrective upswing. It’s likely ready to fall – and to fall hard.
So, what’s likely to happen? We’re about to see a huge slide, even if we don’t see it within the next few days.
Just like it was the case in 2008, the move higher that we saw before the final (biggest) slide in gold, silver, and gold stocks (lower part of the chart), didn’t translate into a visible rally in the TSX Venture Index. Just as the index paused back then, it pauses right now.
Currently, it’s trading at about 600, and back then, it consolidated at about 2500. The price levels are different, but the overall shape of the price moves (lack thereof) is similar. This serves as a signal that the recent upswing in the PMs is not to be trusted.
The above chart is one of the weakest (from a technical point of view) that is seen across the board right now. There is a strong long-term downtrend visible in the TSX Venture Index, and if stocks slide similarly as they did in 2008, the TSXV could truly plunge – perhaps even to the 300 level or lower.
The important short-term detail is that the TSXV just broke to new yearly lows. This is a major (yet barely noticed by most) indication that the next big move lower is about to start.
Having said that, let’s turn to gold.
Let’s start with context:
Between 2020 and now, quite a lot happened, quite a lot of money was printed, and we saw a war breaking out in Europe. Yet gold failed to rally to new highs.
In fact, gold was just trading well below its 2011 high, which tells you a lot about the strength of this market. It’s almost absent.
There’s a war in Europe, and billions of dollars were printed, and gold was below its 2011 highs – in nominal terms! Adjusted for inflation, it’s much lower. And silver and gold stocks’ performance compared to their 2011 highs? Come on…
Truth be told, what we see in gold is quite in tune with what we saw after the 2011 top, and in particular, shortly after the 2012 top. We can also spot similarities between now and 2008. The long-term gold price chart below provides details.
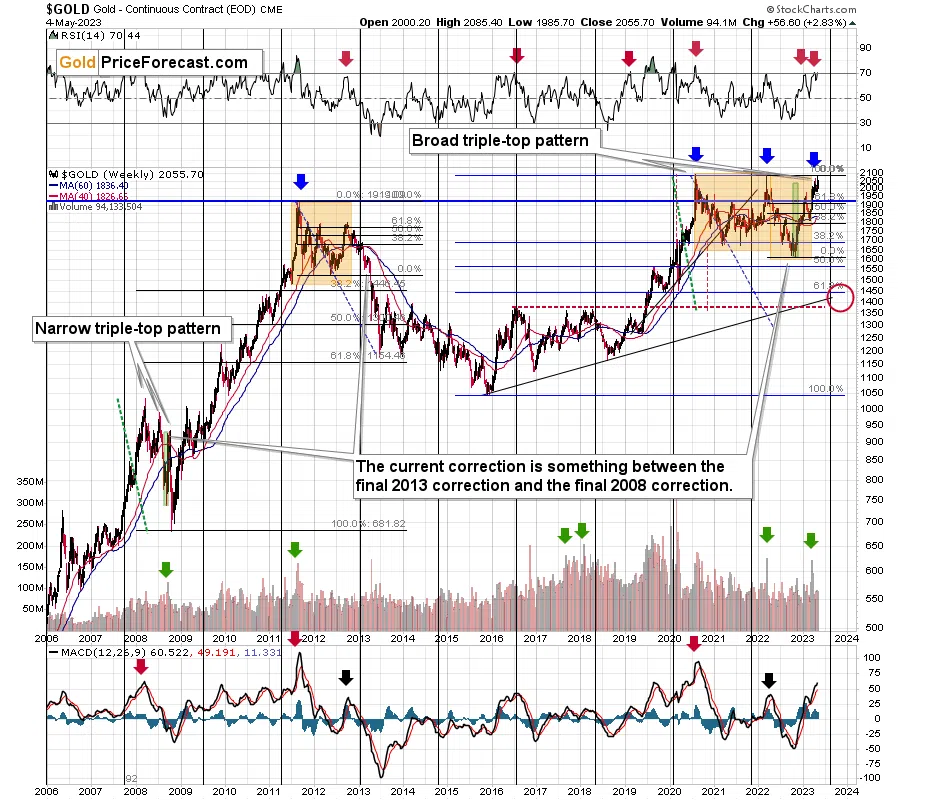
Based on the most recent rally in gold, the price now seems quite similar to what we saw in 2008. This time, we see a triple-top pattern where the tops are far apart, whereas in 2008, they were relatively close to each other.
The link to 2011-2013 is still present, although in this case, the price moves to the upside are more visible.
The RSI above 70 shows how extremely overbought gold is right now and how likely it is to slide in the following weeks and months. I also marked other similar cases with red arrows, and as you can see, they were indeed followed by declines.
Please note that gold’s attempt to move to new all-time highs and the failure thereof are strongly pointing to lower prices ahead. The emotionality that I described in my recent Gold Trading Alerts had probably burnt itself out as gold approached the previous highs. And now, it’s time for logic and cold calculations to take its place. The reality is that real interest rates are going higher, and that’s very bearish for gold prices.
Finally, I marked the big increases in weekly volume levels during gold’s upswings with green arrows.
The most recent case is from 2022, when gold topped.
The same happened in early 2018.
That’s how gold topped in 2011.
And – most importantly – that’s exactly what we saw at the final pre-slide top in 2008.
Please note that the rapid rally that we saw in 2008 before the slide was very much in tune with what we saw recently (note: green rectangles). Consequently, it’s not a bullish game-changer.
Gold recently moved above $2,000, and just as all previous attempts to move above this level failed, we’re likely to see it fail once again.
Thank you for reading our free analysis today. Please note that the above is just a small fraction of the full analyses that our subscribers enjoy on a regular basis. They include multiple premium details such as the interim targets for gold and mining stocks that could be reached in the next few weeks. We invite you to subscribe now and read today’s issue right away.
Sincerely,
Przemyslaw Radomski, CFA
Founder, Editor-in-chief