Gold price didn’t soar todamoon. It didn’t soar at all, yesterday. Instead, it moved back below $2,000 failing the attempt to break above it once more.
Before moving to charts, I would like to quote a comment from below one of my previous Gold Trading Alerts along with my reply. It’s from four days ago (Hi, Eddy! :) ),
We are betting against 90% of the gold experts. When was the last time they got it all right? Or when was the last time they got it all wrong?
The first reply (Hi, Alex! :) ) was:
In 2022 when the Ukraine war was going to send gold to $3,000 ;)
And to that, I added the following:
“Please remember this quote :) "90% of gold experts were bullish in May 2023, when gold was trading above $2,030". It will be interesting to see how it matures in the following part of this year :)”
I’m putting it out here, so that more people can see it.
Let me tell you a secret… Experts are people too :). And people get emotional. It’s easy to be bullish close to the tops because looking back, one sees rising prices. However, that’s the only way that prices can arrive to their top, isn’t it?
Of course, I’m not saying that price increases are essentially bearish. But a rally is just that – something that already happened – it’s not bullish. “Bullish” or “bearish” are words used to describe expectations regarding the future, and “rally” or “decline” are words used to describe something that already happened. One is about the future, the other is about the past.
And while analyzing past scenarios, looking for analogies and seeing how they related to the current situation is indeed a way to create forecasts, this process is much more complex than just stating that what happened recently to the price itself is now going to happen again.
There’s an entire discipline called “technical analysis” along with its multiple sub-disciplines like cyclical analysis, fractal analysis, Elliott Wave Theory, and so on, that is applied in order to arrive with price forecasts.
Naturally, that’s on top of the fundamental analysis that includes its sub-disciplines too, like demographics, geopolitics and so on. There are myriads of things that one takes into account while making a forecast – or at least that one should take into account while making a forecast.
And yet… It’s easiest to just get “infused” with the current emotional sentiment, which means being bullish after a rally and/or close to tops, and being bearish after a decline and/or close to bottoms.
Also, different types of analysis apply to different timeframes. Fundamentals are important with regard to the following years, but are not really important with regard to medium term and they are rather irrelevant in case of the short term.
Silver provides an awesome example. Remember the 2008 slide in silver?

Silver plunged from above $19 to below $9 in about 3 months. Did ANY real fundamental metric change in the meantime? Not at all.
Did the aboveground silver supply change meaningfully?
No.
Did silver become useless because scientists found some sort of substitutes?
No. Nothing really affected the supply/demand dynamics at that time. And yet, silver declined profoundly.
Is the fundamental situation in silver truly spectacular right now?
Please look at the above chart once again.
The fundamental situation in silver can remain spectacular and its price can be cut in half in a matter of couple of months regardless of that.
Are there multiple reasons for gold to move much higher now and in the coming years? And even more of them with regard to silver? Sure there are! In fact, I expect to see both metals higher in the coming years!
And what does this tell us about the possibility of gold and silver to plunge in an extreme manner in the following months? ABSOLUTELY NOTHING.
Just like silver was able to plunge from above $19 to below $9 in about 3 months in 2008, the entire precious metals market can slide this year, especially if the stock market declined just like it did in 2008.
Oh wait, the situation in the stock markets around the world is currently almost exactly like it was in 2008… With the exception that now it’s even more bearish, because this time the initial decline was bigger.

Back in 2008, stocks corrected about 61.8% of their initial decline before complete carnage. That’s exactly what happened recently. It's difficult to imagine a more bearish analogy than what we see right now.
Ok, there’s one extra analogy – the problems in the banking sector. We saw that in 2008 and we saw it recently as well.
As stocks slide, the precious metals sector, especially junior mining stocks are likely to slide with them. The lower part of the above chart features the XAU Index, which is a proxy for both gold and silver stocks – senior producers. The GDXJ is a bit more volatile, so the odds are that if XAU declines, the GDXJ will decline even more. And since the former decline from above 180 to below 80 in 2008, something truly epic (and profitable for those positioned correctly) is likely in the cards.
Again, this is regardless of the (generally positive in the long run) fundamental situation. Just because something is a good reason for gold / silver / mining stocks to move higher, it doesn’t mean that it’s a good reason for the above to rally now or soon. It could be a reason for those markets to move higher in the following years and something that won’t prevent the market’s decline in the meantime.
To be honest, I don’t blame either my fellow colleagues for getting emotional about the market situation and I don’t blame anyone that got “overly emotional” while commenting and arguing about the outlook. In fact, in my world the concept of blame doesn’t even exist. Besides, I really do think that deep down, everyone is good. We’re all human and it’s easy to get carried away by all sorts of emotional triggers.
And the current market juncture makes it very difficult to stay calm and objective. After all, we are very likely in the “return to normal” stage.

That’s when the vast majority of market participants expect the previously unsustainable rally to be continued, even though much has changed and it’s already a different stage of the market. It’s no longer a bull market.
I’m writing about the stock market here, but the emotionality spreads to other markets as well. That’s most likely why people are not reacting to the massive increases in real interest rates as much as they “should”.
The current expectations regarding the Fed’s interest rate decisions also fall in line. Here’s a chart that Simon just shared in the comment feed below one of the recent Gold Trading Alerts:

Market’s expectations are MUCH more dovish and bullish for stocks, than Fed’s. “Don’t fight the Fed” doesn’t apply now?
And that’s Fed’s forecast, which assumes that inflation will come back down. If it does – real interest rates move higher. If it doesn’t, the Fed will need to keep raising rates. Which means that real interest rates are likely to move higher anyway. Either way, the implications for the precious metals market – and for stocks – are bearish for the following months.
Also, while I’m writing about the Fed. Please note that Jerome Powell is anything but direct. In my opinion, he really wants to avoid the blame for the carnage that's likely to hit the general stock market. When the plunge happens, he doesn't want to be the one that triggers it, but rather someone that tries to prevent it.
The disillusionment will be painful for many.
Here’s another chart from the comments below one of the recent Gold Trading Alerts (thanks, Steven):
Steven’s comment on the above chart was:
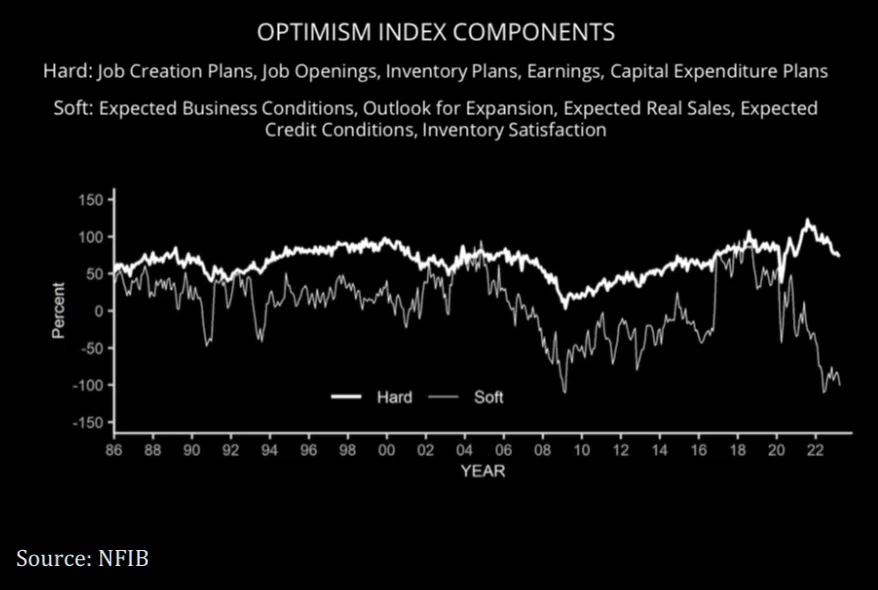
I came across this interesting chart of the Optimism Index Components, which I thought was worth sharing with you. The reason I am sharing this is to highlight another similarity to 2008. If you look at the chart, you can see the massive gap between the expectations of a hard landing vs. a soft landing. I noticed that prior to the Global Financial Crisis (GFC), the gap was also wide, but then the gap closed as investors adjusted their expectations on the economy. It feels like we are in a similar situation, as you pointed out a few days ago when you discussed the "Return to Normal" phase.
(…)
The gap between soft and hard inputs is getting very wide.
I added the following to the above:
I agree with your interpretation of this chart. Those "in the know" look at the leading indicators and can read the signs before they become apparent. Back in 2008, the markets plunged, when the "hard" indicators started to decline profoundly and moved to new lows - following the "soft" ones.
While the soft indicators are below their 2020 lows, the hard indicators are far from them. It looks like a massive decline is still ahead.
All the above-mentioned things are connected. The common denominator is the emotional stage of market participants. And it all points to much lower stock values ahead, leading to lower precious metals and – in particular! – junior mining stock values ahead.
Those are all complex matters, but sometimes the best way to handle complexity is through simplicity.
And there are fewer more straightforward things than seeing an invalidation of a breakout above a very important price level.
That’s what just happened in gold.
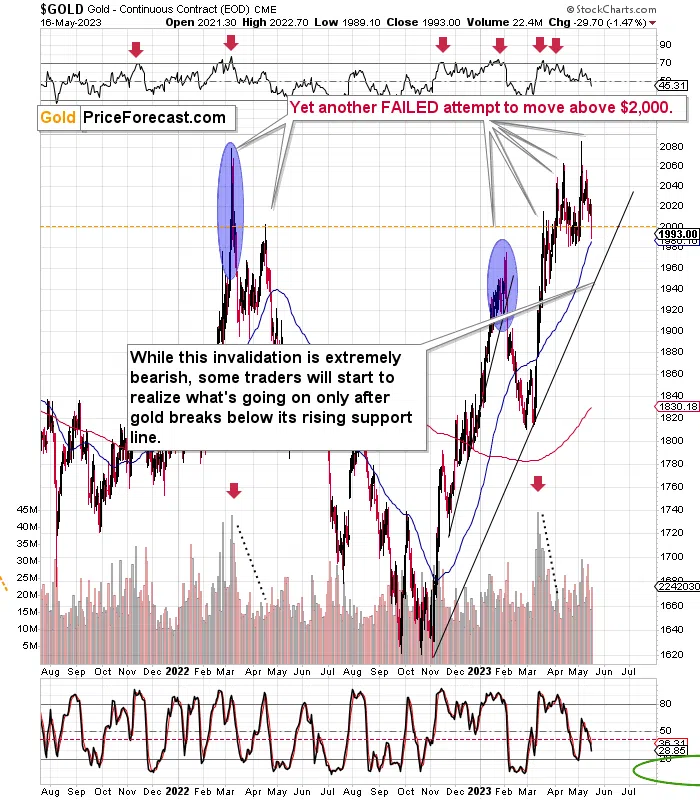
Instead of breaking above the previous all-time (nominal) highs, gold price invalidated the move above the all-important $2,000 level. It happened not just in intraday terms, but also in terms of the daily closing prices. In layman’s terms – it was a big deal.
It was nothing surprising, though. At least if you’ve been following my analyses for some time now.

Gold was after not just one profound weekly reversal, but after two weekly reversals. This was an extremely bearish combination, and yesterday’s move back below $2,000 is a normal – and initial – consequence of those technical developments.
Markets have been ignoring rising real interest rates for a long time, but with the previous high being reached, it seems that this short-term upswing is over. The move back below $2,000 is just the first step on a huge road to much lower price levels.
When the next step arrives (and it could be soon), and gold moves below its rising support line (visible on the previous chart), many will only then start to realize that the trend changed. And at those times, junior miners will likely already be trading at much lower price levels.

Please note that the GDXJ has not only invalidated its breakout above the early-2023 highs, but the way in which they performed recently is very similar to what we saw in early February.
In fact, on Monday (May 15), I wrote the following:
Namely, the volume on which the GDXJ ETF (a proxy for junior mining stocks) moved higher in the final hour of Friday’s trading was huge. When we saw something like that in a previous similar situation (after a bigger rally), that meant that the big slide was about to start, regardless of the immediate-term follow-up.
The immediate-term follow-up was alike as well. The GDXJ shot up very briefly, to decline some more shortly thereafter.
Yesterday it stopped at the previous monthly low, but based on the similarity to early 2023, it seems that another big move lower is about to start. Gold futures are down in today’s pre-market trading, so the odds are that GDXJ will decline one more time today. And when it does, it’s likely to kick the door wide open to bigger declines.
It’s difficult to stay the course in this (particularly emotional) stage of the bear market in stocks (profits from the short position in the FCX make it more pleasant, though), but it’s also the most profitable thing to do for many. The best time to prepare for the declines is not after the huge decline is halfway done – it’s before that move takes place. Right now, it’s still early.
Also, if things get hot and an intraday update is required, I’ll keep my Gold Trading Alert subscribers informed.
Thank you for reading our free analysis today. Please note that the above is just a small fraction of the full analyses that our subscribers enjoy on a regular basis. They include multiple premium details such as the interim targets for gold and mining stocks that could be reached in the next few weeks. We invite you to subscribe now and read today’s issue right away.
Sincerely,
Przemyslaw Radomski, CFA
Founder, Editor-in-chief