


What September’s gold price forecast and how well did it go?
In today’s article, we’ll first check and then I’ll move on to provide you with my gold price forecast for October 2026.
[Exclusive to GoldenMeadow.eu and GoldPriceForecast.com]
But first, a quick recap:
- Gold settled on Tuesday at $4,179.70, up $11.30, after Monday's $153 decline to its lowest close since August 5
- Silver settled at $61.15
- The 30-year Treasury yield reached 5.61 percent, its highest since 2002, the 10-year closed at 5.28 percent
- The USD Index closed at 101.37, its highest since late July, after touching 101.60 during the session
- Consumer confidence fell to its lowest since 2014
- New York Fed President Williams said the next hike might wait until December.
The month ends today, and this analysis does two things. It scores the gold price forecast for September 2026 that I published on September 2, and it lays out the gold price prediction for October 2026 from the levels I have published since.
What the Gold Price Forecast for September 2026 Got Right
About a month ago, I wrote that gold had risen about 10 percent in August and that "three sessions have now cut its entire 2026 gain to under 1 percent," and I added: "The gold price forecast for September 2026 might be completely different from what we saw last month, though."
It was. Gold futures went from $4,396.40 on September 1 to $4,168.40 on September 28, and the table below scores the specific calls against the tape.
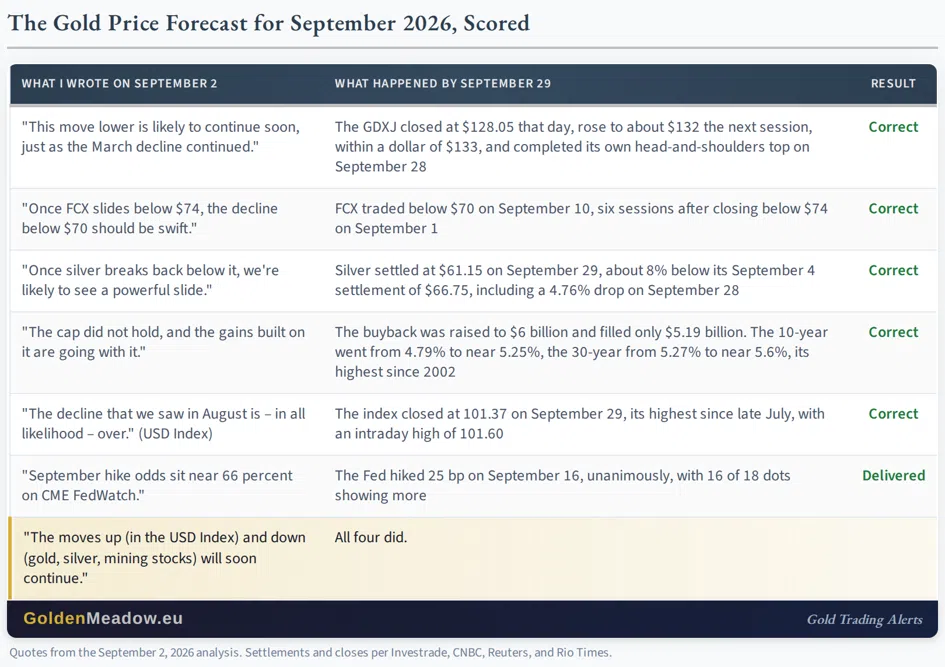
Three of those quotes deserve a sentence each, because they were the structure of the month.
On the miners, I wrote: "This move lower is likely to continue soon, just as the March decline continued." The GDXJ closed that day at $128.05, rose to about $132 in the next session, within a dollar of $133, and then completed its own head-and-shoulders top on September 28 with a decline about 7.5 times the S&P 500's. It just closed at $115.80
On the bond market, I wrote: "The enlarged buybacks do not even begin until September 9, and the yields they were designed to hold down have already moved past them. The cap did not hold, and the gains built on it are going with it." The Treasury raised the operation to $6 billion on September 9, filled $5.19 billion of it on September 10, and the 30-year yield went on to its highest level since 2002.
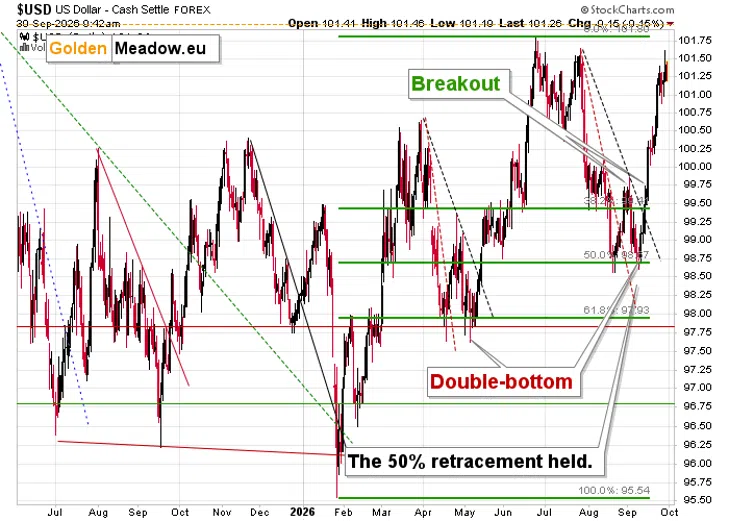
On the dollar, I wrote: "A market that shrugs off its reasons to fall is telling you which direction it wants to go." The index was near 99.5 then, with Washington pressing Tokyo for a stronger yen. It closed on Tuesday at 101.26.
Gold Price Prediction for October 2026: The Map
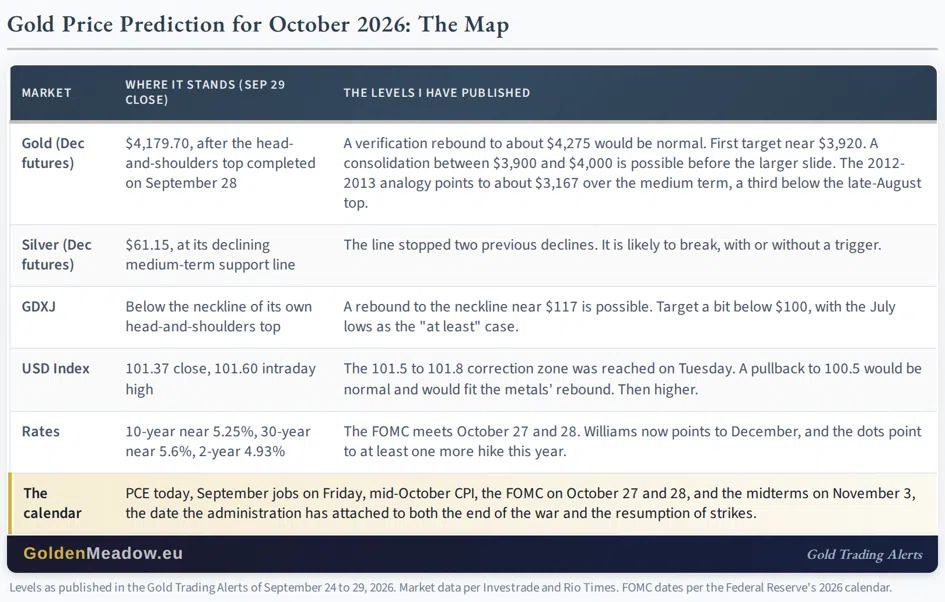
October opens with the pattern I described through September completed on September 28, and with the levels for what follows already published. Here they are in one place.
Gold Price
In yesterday’s Gold Trading Alert, I wrote the following:
Now, I know that we all got happy with metals’ yesterday’s decline, but I have to be objective here (and always). The completed head-and-shoulders patterns are quite often followed by some sort of verification. This means that a rebound to the $4,275 or so (or lower) would be rather normal, and not a reason to be concerned.
The fact that gold, silver, and miners declined yesterday without dollar’s help continues to be the key bearish confirmation.
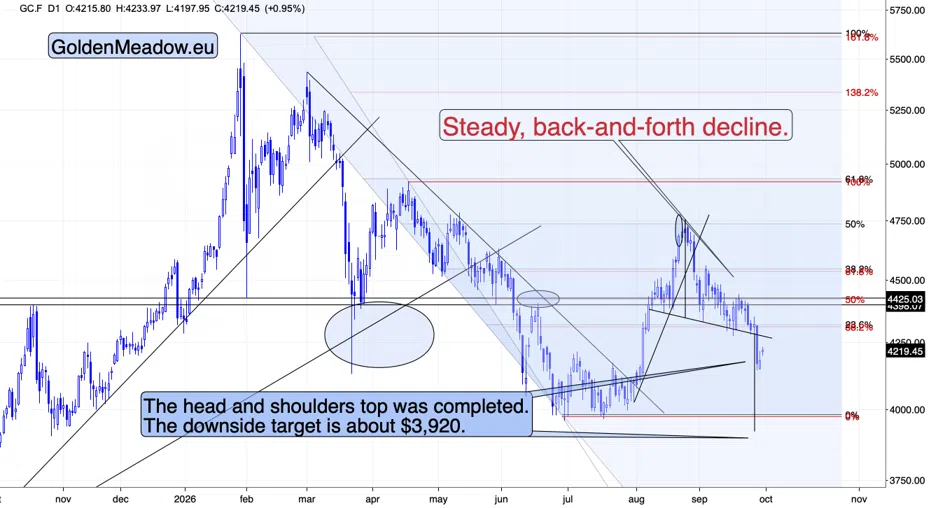
Tuesday's $11 gain, on the weakest consumer confidence since 2014 and a 3.5 percent drop in WTI, is the small kind of that rebound. Today’s pre-market move to $4,234 is also in perfect tune with the above.
What matters for October is the sequence after it: a first target near $3,920, a possible consolidation between $3,900 and $4,000 that would take one to three weeks, and then the larger slide. The 2012-2013 analogy I described on September 25 puts the medium-term destination near $3,167, a third below the late-August top, and that analogy has run at roughly twice the speed of the original so far.
Silver Price
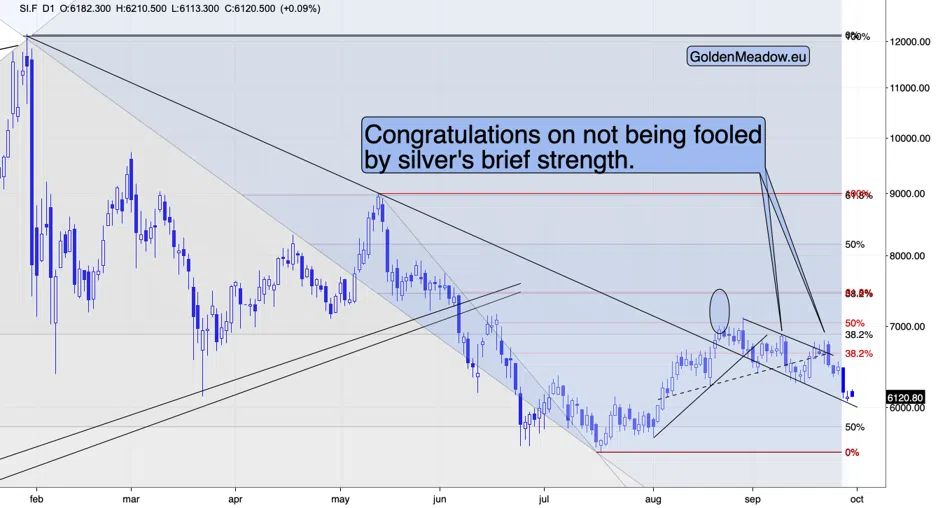
Silver price futures settled at $61.15, down 0.92 percent on a day gold rose, which is the underperformance-out-of-a-top pattern it has shown all month. It is sitting at the declining medium-term support line that stopped two previous short-term declines. Yesterday I wrote that "it will break sooner rather than later," and that silver "can – and is likely to – decline on its own, anyway," as it did on Monday. That is the October read for silver: the line is the last support of the summer, and the metal has already shown it does not need a trigger.
Gold Mining Stocks
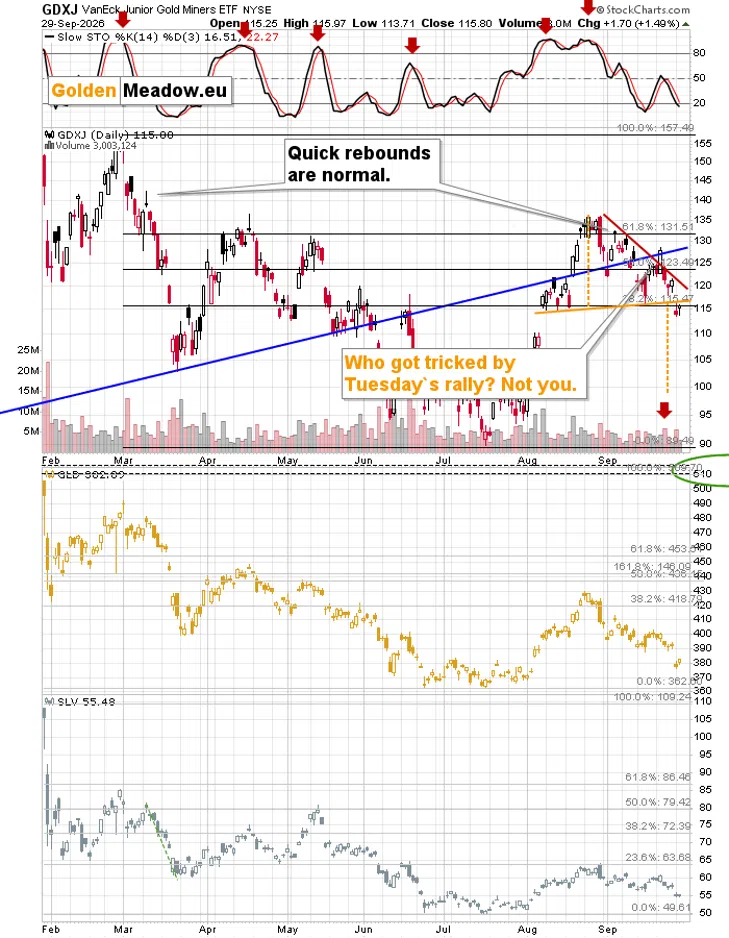
The GDXJ completed its head-and-shoulders top on Monday with a decline of about 7.5 times the S&P 500's. The neckline near $117 is where a verification rebound would run into resistance, and the H&S-based target is a bit below $100, working on an "at least" case.
Whether the miners fall much more than gold in October depends on the stock market, and the stock market spent Tuesday in a tight range, waiting for today's inflation data, with the 30-year at a 24-year high.
The Dollar
The index touched 101.61 on Tuesday, inside the 101.5 to 101.8 correction zone I named last week and closed at 101.37. A pullback to 100.5, the previous highs, would be normal from here and would fit the verification rebound in the metals. After that, the multi-year base I described on September 24 argues for a larger move higher, and when the index moves that way, gold "will most likely respond with even bigger declines."
Rates, The Fed, And the Calendar
The 10-year near 5.25 percent and the 30-year near 5.6 percent are the reason the metals have been falling without the dollar's help, and Tuesday's consumer confidence reading, 81.9 against 89.2 expected, did not move them. Williams said the Fed might wait until December for the next hike, which took some pressure off the two-year, while the dots still show at least one more this year. The FOMC meets October 27 and 28.
The August PCE data arrives at 8:30 a.m. Eastern today, the September jobs report on Friday, and the September CPI in mid-October. Behind all of it sits November 3: the president has said the war ends "right after the midterms," the Journal reports strikes resume after them, and Monday's talks ended with "I offered them nothing." The pre-election window has been the weak stretch for gold in every tightening cycle I examined on September 8, and this one has run to form.
Crude Oil and the Gold Price Forecast for October 2026
In yesterday’s Gold Trading Alert, I wrote that crude oil might bottom "close to its previous low, the 38.2% Fibonacci retracement and the rising support line," and that this "would fit the scenario in which we see a small rebound in the precious metals market that is then followed by a much bigger decline."
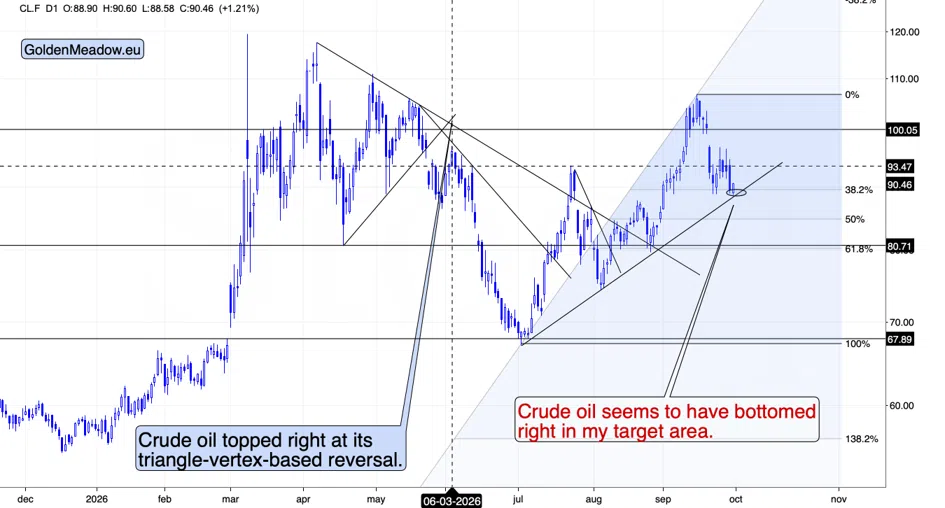
WTI futures dipped to about $88.60 this morning, into that area, and reversed to trade near $90.50, above Tuesday's $89.38 settlement. That is the 38.2% Fibonacci retracement of the rally from the July low near $68 to the mid-September high, and it is where the rising support line sits. Crude oil seems to have bottomed right in my target area.
Here is – once again – why it matters for gold (we have new Diamond Members, and I’d like to get them up to speed with the crude oil - gold link). From the mid-September high above $105 to below $90 this week on the front-month chart (part of that gap is the switch from October to the November contract), crude gave gold the best backdrop it has had since the summer. Gold fell anyway, from $4,333.50 on September 15 to $4,179.70 on Tuesday. The metal did not need oil to rise in order to fall.
Now oil appears to have found its floor, and the reasons for it to hold are the ones that pushed it above $100 in the first place. Hormuz remains restricted, Monday's talks ended with "I offered them nothing," an energy analyst told CNBC that the market is pricing a return to hostilities after the midterms, and the EIA expects prices to stay elevated until flows normalize, with most shut-in production back only in the second half of 2027. Diesel, the fuel the Fed's inflation data records, is still above $6.
In the channel that has driven gold since Jackson Hole, higher oil means hotter inflation data, higher yields, and a firmer dollar. The calendar puts oil's next move right in front of the September CPI in mid-October and the FOMC on October 27 and 28. Gold is in the first stage of the October sequence this morning, the verification rebound, with the pre-market move to $4,234. Crude oil turning up from its target area is the most likely trigger for the second stage, the move toward $3,920.
The risk to this view is a real deal: a White House official told CNN on Monday that the president is open to sanctions relief if there is concrete progress toward a nuclear agreement. September already showed what cheaper oil does for gold, though. Neither path in crude gives the metal what it needs, which is a dovish Fed and a weaker dollar.
Gold Price Forecast for October 2026: Summary
My outlook and positions are unchanged, and the profit-take levels remain in place. I might need to adjust them soon given gold’s recent volatility, though.
September delivered what the September 2 analysis described: the miners' failure, FCX below $70, silver's slide, the bond market through the Treasury's cap, the dollar's breakout, and the Fed's hike. October opens with the head-and-shoulders top completed, a verification rebound possible toward $4,275, a first target near $3,920, and the dollar at the edge of its correction zone with a larger move behind it.
The gold price forecast for September was that the moves up in the dollar and down in the metals "will soon continue." The gold price prediction for October is that they have further to go even if the next few days bring us a rebound.
Thank you for reading the free version of today’s analysis. More on the above technical and fundamental issues as well as analysis of other markets (plus the profit-take levels for our trading positions and details of our investment/insurance positions) is available in its full version. I encourage you to subscribe for the premium version today. If you’re not ready to subscribe yet, I encourage you to sign up for my free gold newsletter now.
Thank you.
Sincerely,
Przemysław K. Radomski, CFA