


Gold rose about 10 percent in August, its best month since January.
Three sessions have now cut its entire 2026 gain to under 1 percent, and today's modest bounce has returned only a fraction of what Tuesday alone took away.
The gold price forecast for September 2026 might be completely different from what we saw last month, though.
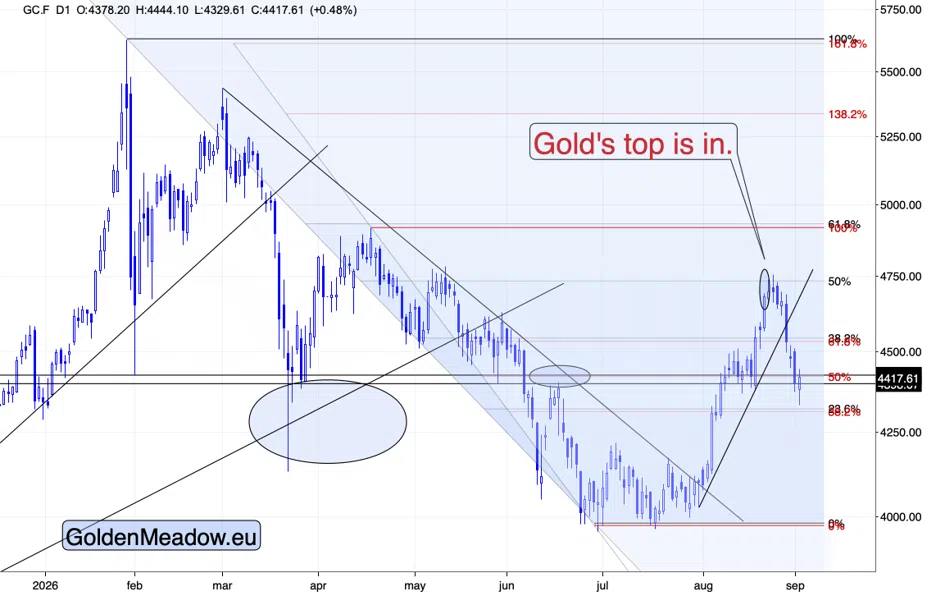
You see… The speed of the decline is not the interesting part. The interesting part is what was on the screen while it happened.
The Gold Mining Answered
Yesterday, I wrote: "With gold futures down again this morning, that resilience will probably be tested today, and – in all likelihood – it will fail."
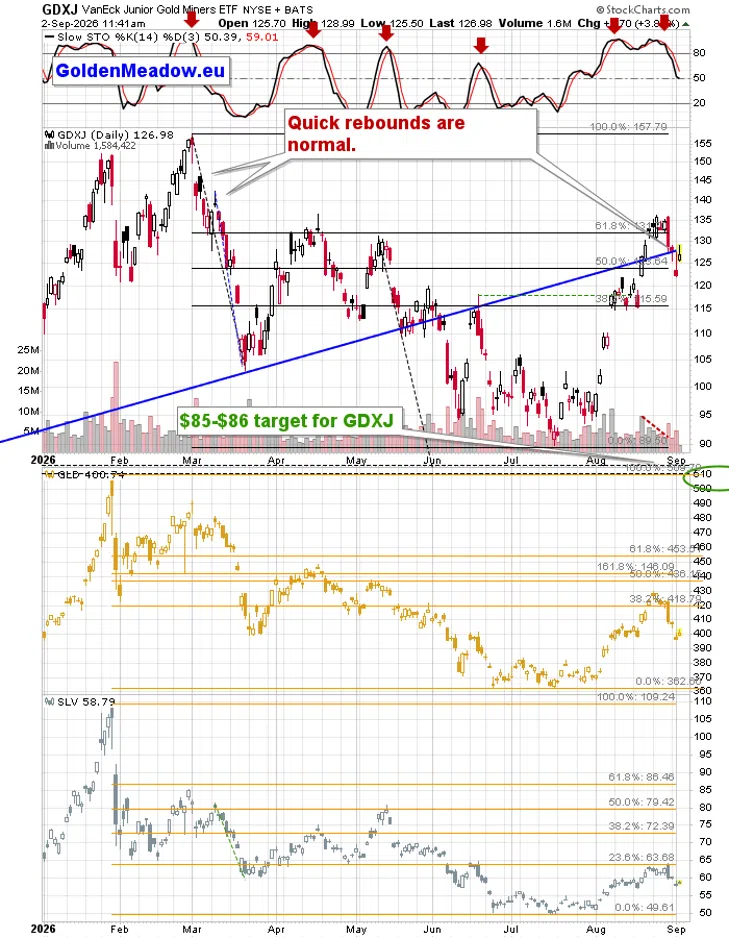
It failed.
The GDXJ closed Tuesday at $122.28, down over 4 percent and roughly 10 percent below its late-August high, while gold futures closed at $4,396.40, down 1.9 percent, their third consecutive decline and the longest losing streak since early July. Miners falling more than twice as fast as the metal is the beta profile of a decline, not of a pullback inside a rally.
Today’s move back to the rising, blue resistance line serves as a verification of the decline. The resistance held.
Also, if today’s daily rally seems concerning, please note that we saw exactly the same thing – twice – in March after the initial part of the decline. This move lower is likely to continue soon, just as the March decline continued.
FCX Crossed The First Level
On Monday, I wrote: "Once FCX slides below $74, the decline below $70 should be swift."
FCX closed Tuesday below $74, down more than 3 percent, and copper is barely changed today.
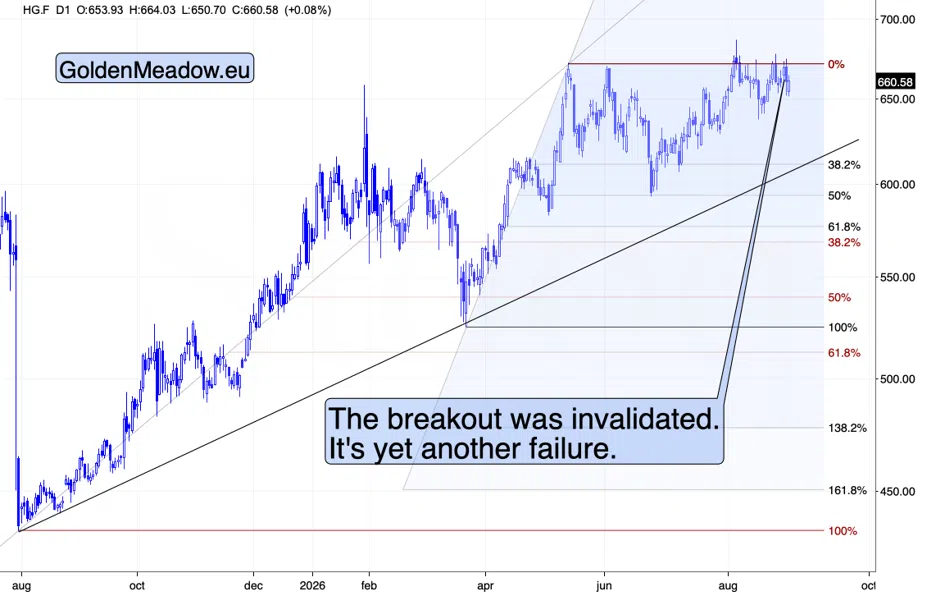
The metal stalled short of a record even as Chile's output fell to its lowest since 2011, so the most supportive supply story in years produced a failed breakout instead of a new high, and the stock stopped responding to its own bull case before the metal did.
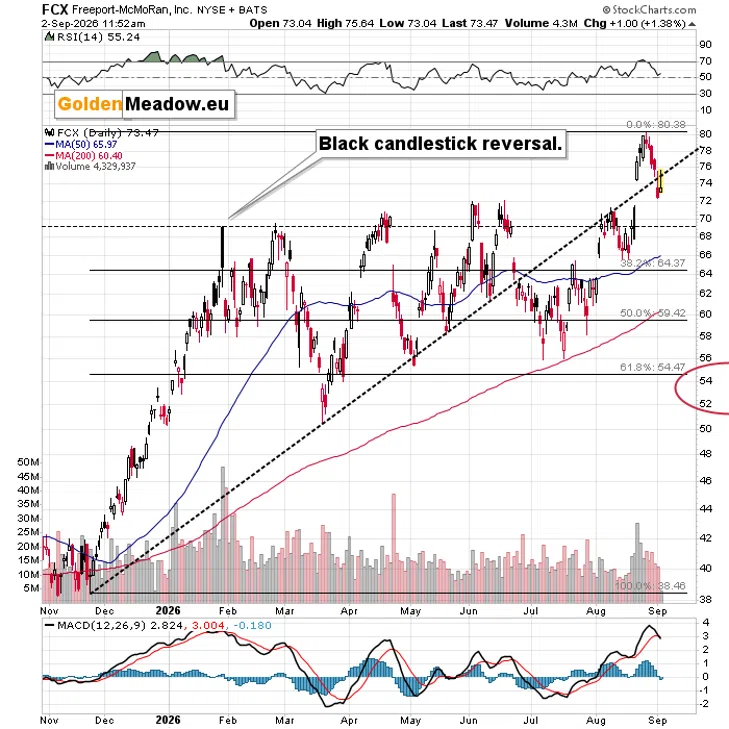
Today, the FCX moved briefly up just as GDXJ did, but the size of FCX’s move was smaller and almost the entire daily gain was already erased. This convinces me that getting back on the short side of the FCX trade when it was above $75 was indeed a good idea.
Silver On Its Line
Yesterday, I also wrote: "Once silver breaks back below it, we're likely to see a powerful slide."
Silver fell about 3 percent on Tuesday, more than gold, and today's small bounce alongside gold is the kind of rebound that follows such a session, not a reversal of it. What matters is where silver closes relative to its declining resistance line.
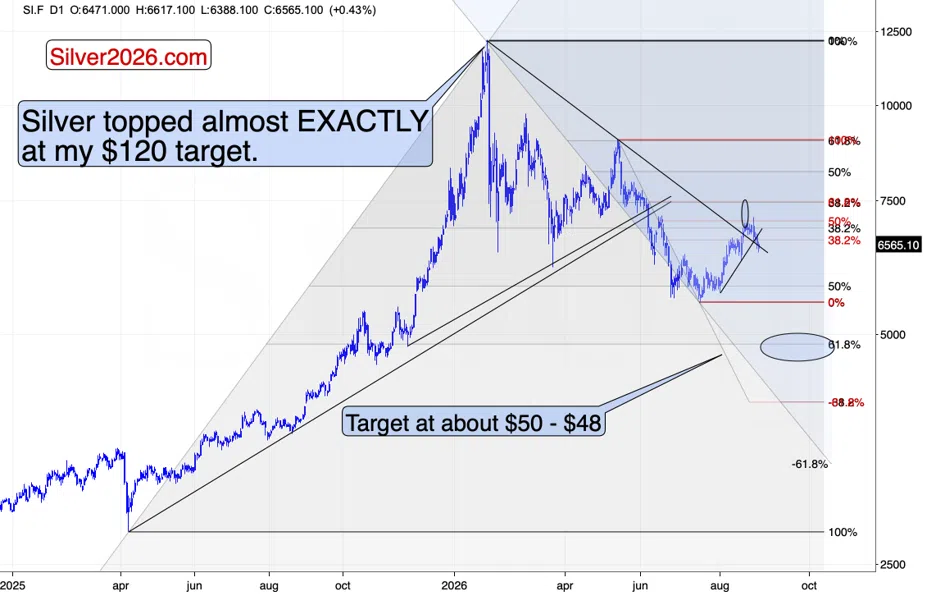
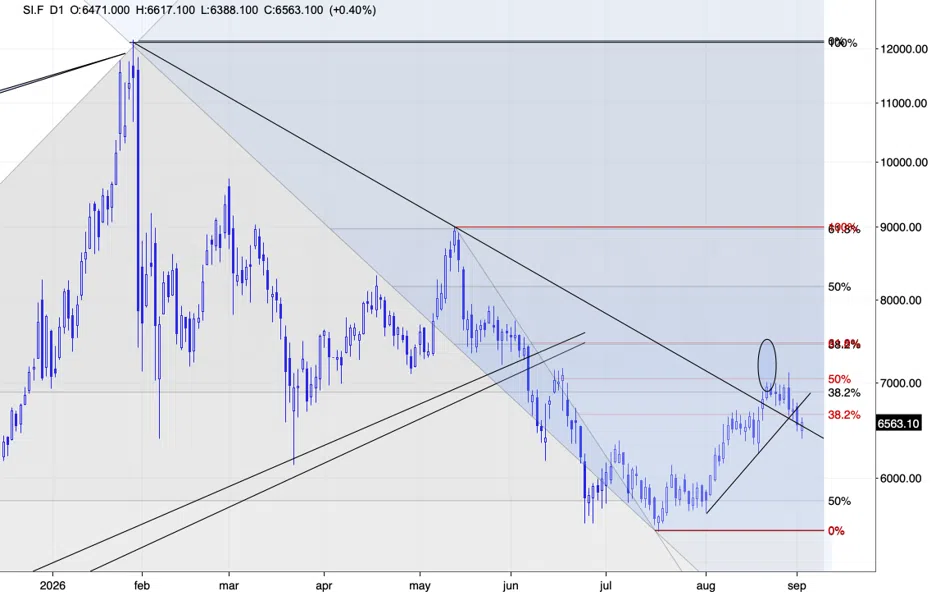
So far silver moved briefly below it, without a confirmed breakdown – nothing really changed yet. In consequence, forecasting higher gold and silver prices seems to be quite risky here.
The President Stepped Aside
President Trump said of Chair Warsh this week: "I have a lot of respect for him and he'll do what he has to do." The president who spent a year attacking the previous Fed chairman for not cutting has publicly cleared the road for a hike, on the same day his own Treasury Secretary argued that "you don't raise into a supply shock."
Governor Barr then said the Fed "should act decisively to raise rates" if inflation is not moderating, and September hike odds sit near 66 percent on CME FedWatch, up from roughly 30 percent before Jackson Hole. The data offered no rescue: ISM prices paid held at 71.1, rising for the 23rd straight month with petroleum-based inputs named as a driver, and Friday's payrolls are the last release with any chance of changing that.
The Cap Did Not Hold
August's rally in gold price leaned on one idea: on August 19, after the 30-year yield hit a 19-year high, the Treasury doubled its buybacks of long-dated bonds, and the debasement trade came back to life. Stanley Druckenmiller, who trained the Treasury Secretary, called it "price management" in a Wall Street Journal op-ed last week and wrote that governments defending prices against fundamentals always lose.
The market has already voted. The 10-year yield rose to 4.79 percent on Tuesday, its highest since January 2025, the 30-year touched 5.27 percent, above where it stood before the buybacks were announced, and Japan's 10-year crossed 3 percent for the first time since 1996. The enlarged buybacks do not even begin until September 9, and the yields they were designed to hold down have already moved past them. The cap did not hold, and the gains built on it are going with it.
A Hundred Targets, A Two-Week Low
Yesterday was the largest strike day since the truce collapsed. US forces hit about 100 targets around the Strait of Hormuz and, for the first time, two Iranian government tankers under a new "tanker for tanker" policy, after two supertankers were hit while exiting the strait that morning. Iran answered with roughly 25 ballistic missiles toward Jordan and drones at Bahrain, Kuwait, and Erbil, most of them intercepted, and President Trump said an agreement with Tehran "isn't worth the paper it's written on" while warning that a larger attack is "waiting in the wings."
Brent rose about 5 percent to near $95, its highest since late July, WTI crossed $90, and gold price fell anyway.
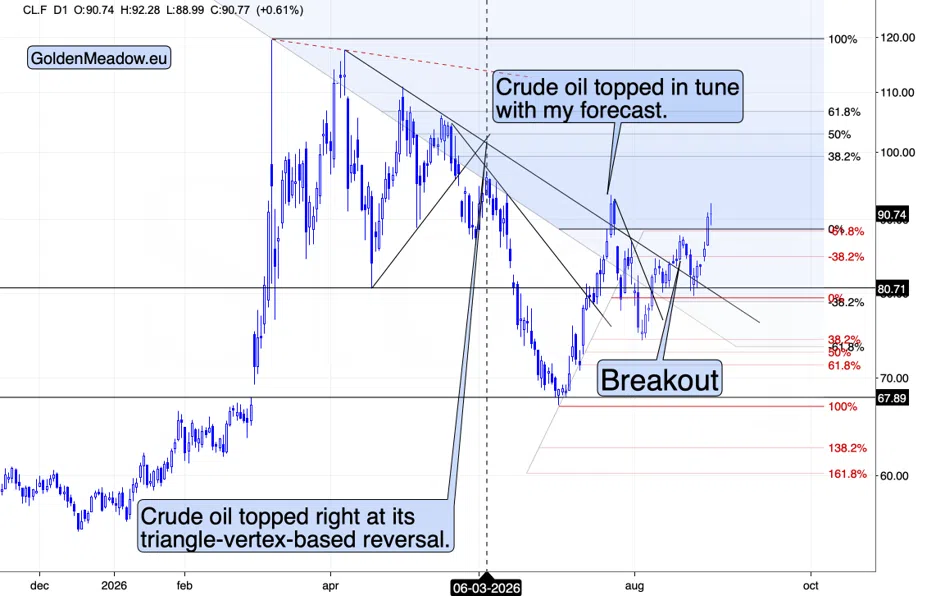
One detail matters for the coming weeks: a US official described the strikes as an effort to "mow the lawn" that "bought at least a month" of lower risk to shipping, and a record 17 million barrels transited Hormuz on Monday. The escalation story and the flow story now point in opposite directions, and the metal responded to neither.
Gold Price Prediction and the Dollar
Yesterday, I wrote: "All this means that the decline that we saw in August is – in all likelihood – over."
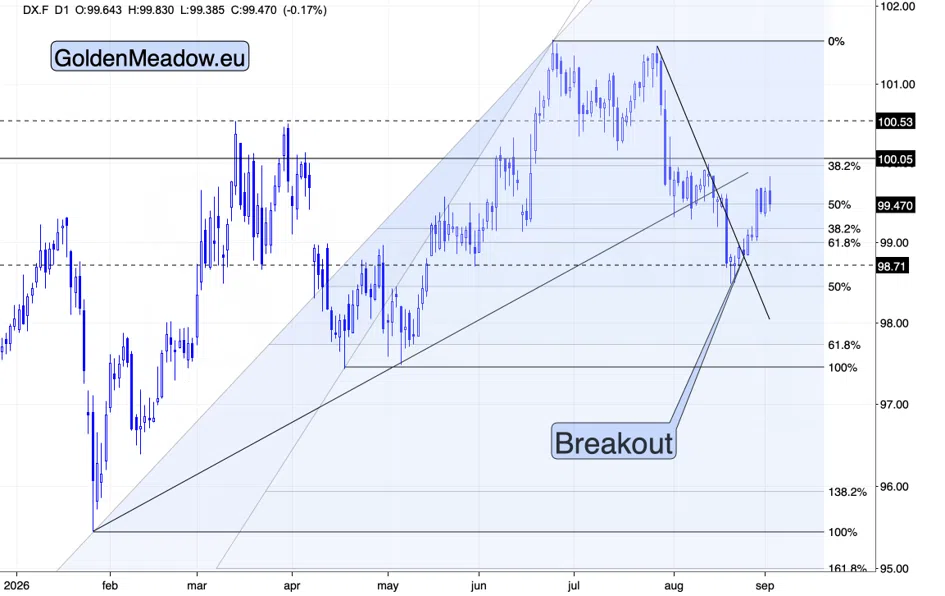
The test came quickly. Treasury Secretary Bessent spent the G20 meeting pressing Tokyo toward a stronger yen and a rate hike, the BoJ governor signaled a hike is possible this month, and Japanese yields hit a 30-year high, all of which argues for a weaker dollar against the largest component of the index after the euro.
And yet… The USD Index held above its broken resistance line through all of it, and today's slight pullback to about 99.5 is the same normal post-confirmation behavior I described on Monday. A market that shrugs off its reasons to fall is telling you which direction it wants to go.
The Calendar
Friday brings the August payrolls, US markets are closed Monday for Labor Day, the Treasury's enlarged buybacks begin September 9, the August CPI carrying last month's oil arrives September 10, the FOMC decides September 15 and 16, and the BoJ meets September 17 and 18 with its own hike expected.
Gold Price Forecast for September - Summary
My outlook and positions are unchanged, and the profit-take levels remain in place.
Three called levels arrived in one session: the GDXJ's resilience failed, FCX crossed below $74, and silver is testing its line. The dollar held its breakout through a yen campaign, the bond market overran the Treasury's cap before the cap even took effect, and the president took himself out of the way of a hike.
It looks like today’s session is nothing more than a breather and that the moves up (in the USD Index) and down (gold, silver, mining stocks) will soon continue.
There’s a tremendous profit potential in all this, especially when you look at the situation from the long-term point of view, which is what we do in the Gold Trading Alerts. If you’re not ready to subscribe yet, I encourage you to sign up for our free gold newsletter.
Sincerely,
Przemyslaw K. Radomski, CFA