Gold is bullish on higher time frame charts where we expect a break to new ATH high, but ideally, this will occur after the current complex correction is completed.
Notice that recovery from 1970 to 2070 was made by three waves, ideally it was wave B as part of a higher degree fourth wave that can be even a triangle.
If we are correct then more slow and sideways price action will show up to complete the pattern; ideally still some time this month when we will start looking up towards 2100. If we are correct then 1958 and 1971 levels should hold as a support. If they are broken then the structure and trend will change.

For gold is important to note that on the latest Fed’s rate decision, there were some important signals for a potential end of hikes:
• The staff predicted a mild recession in general, however, a forecast is for modest growth, not a recession.
• A decision on a pause was not made today.
•The economy is likely to face headwinds from credit conditions.
• Policy is having an impact on housing and investment.
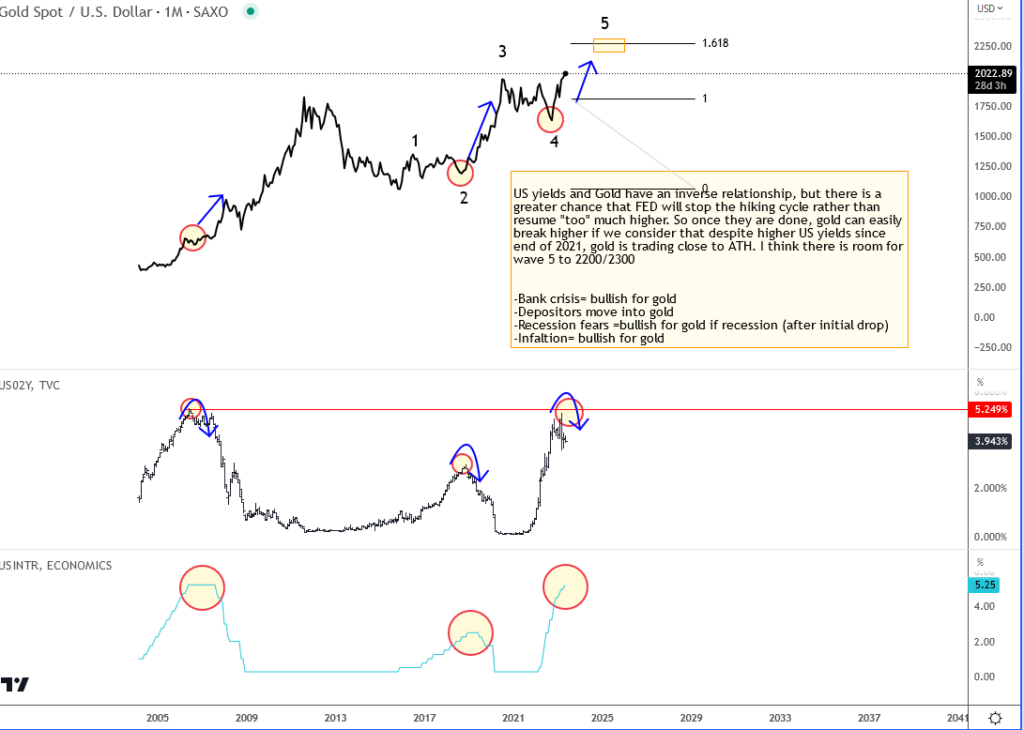
If FED is really going to be done soon with rates then Gold can easily break higher if we consider that despite higher US yields since the end of 2021, Gold is trading close to ATH.
So, if US yields are going to stay sideways or move down at some point, maybe later this year, or 2024, then gold will rally. Also, the bank crisis in 2023 is supportive for gold as some depositors moves in to physical gold.
For more short-term outlook on gold, make sure to check out our premium services at www.wavetraders.com, and see our charts for 14 days free.
Trade well,
Grega