Gold failed to rally above the all-important $2,000 level yesterday, but miners finally showed strength. Is this a buy signal after all?
Things should be simplified as much as possible. But not more.
I’m usually emphasizing that gold miners’ weakness relative to gold is a bearish sign, and gold miners’ strength relative to gold is a bullish sign. That’s true in almost all cases. Yes, almost. There are times when it works differently, but I don’t want to overcomplicate things in each and every analysis.
Just like you could say that 2 + 2 = 4. Is it always the truth?
Yeah, well… kind of.
In physics, when you join particles that have some mass, the mass of them together is not exactly equal to the sum of those masses, because some energy had to be used. It’s much more complex than that, but my point is that 2 + 2 = 4 in the case of mathematics, but not necessarily in all cases in physics. Being in the realm of mathematics was probably the underlying assumption that everyone made when I wrote the above, but I actually never wrote that we were discussing the realms of math and not the ones of physics.
Just as nobody is making full disclosure while stating that 2 + 2 = 4, I haven’t been making full disclosure regarding the link between gold stocks and gold. In both cases, the simplification serves the same purpose: to provide information in a way that’s most useful.
Getting back to the point… So, are strong miners relative to gold a bullish sign?
Yeah, well… kind of.
That’s definitely the case most of the time.
The thing is, however, that it seems that right now we might be in one of those exceptional times.
Before I jump into the main analytical course of today’s Gold Trading Alert, I’d like to briefly insert the FCX chart along with a quick comment.
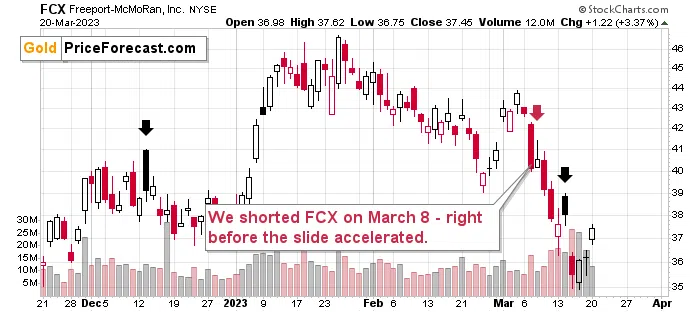
The comment is that FCX rallied by over 3% shortly after we took profits from the short positions that we had entered on March 8. So, if you followed that trade, you not only entered very early in the fastest drop in months, but you also exited very close to the local bottom – congratulations once again! That was our sixth profitable trade in a row (taking unleveraged instruments into account).
Having said that, let’s dig into the long-term chart featuring the HUI Index (proxy for gold stocks) and gold.

The black rectangles on the above chart show periods when gold stocks are weak relative to gold – they have low leverage to it. This suggests that the trend is about to change.
However – and this is the key exception that I want to emphasize today – this relationship can be turned upside down at the very end of a given move, especially bigger moves.
This is most likely (that’s very sector-specific; there’s no other research on that topic that I know of besides my own analysis) one of the ways in which the specific Wall-Street rule is seen in the precious metals sector.
The rule is that at the end of a given upswing, the worst performers (and, in general, companies with the poorest fundamentals) rally strongly. Why would this be the case? The tops are formed when the investment public enters the market. Those investors are rather uninformed and simply follow the herd. They but those cheap assets without stopping to reflect and ask if there’s a reason for them to be cheap in the first place.
Are the current times highly emotional? Of course!
Does this support herd-following mechanisms? You bet!
So, is there a good chance that the “buy the cheap, regardless of… whatever!” mechanism was triggered as well? Yes!
The above chart shows that this is quite often the case in the case of bigger rallies: after a period of weakness, the rally actually ends with a brief return of leverage. It’s a sector-specific bull trap.
It can also work the other way. In fact, this very mechanism started the 2016 rally – there was a fake decline and a fake breakdown, despite the fact that we hadn’t seen similar moves in gold at that time.
What followed then? A sharp rally.
What’s likely to follow now, given that everything is opposite?
A sharp decline.
All in all, while in most cases gold stocks’ strength relative to gold would be bullish, this time it seems that the implications are precisely opposite.
Also, speaking of relative performance, please take a look at the most recent immediate-term price moves in gold and silver.
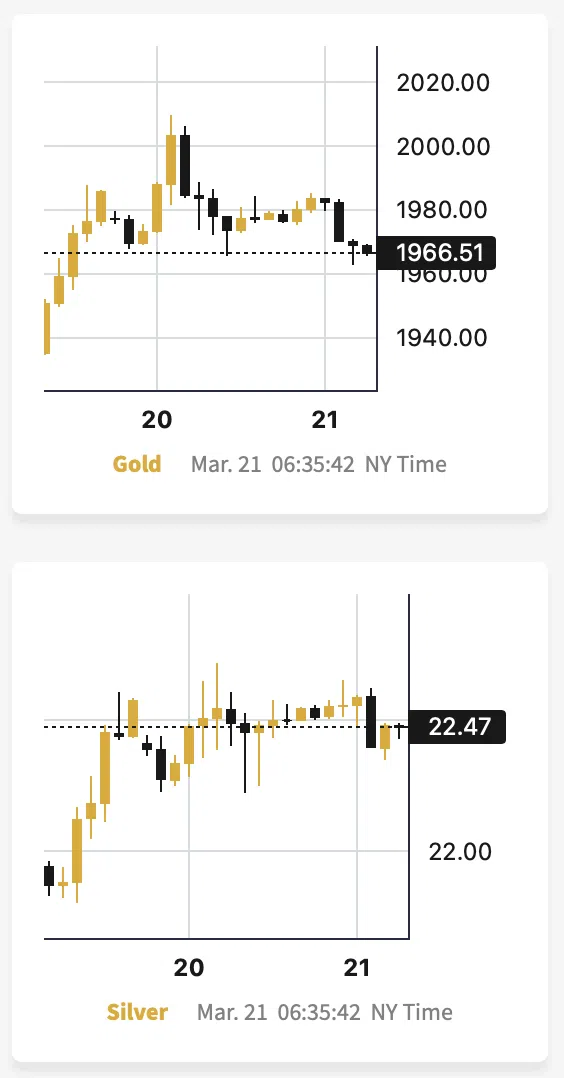
Silver just outperformed gold on a very short-term basis. While gold didn’t move close to its recent intraday high (above $2,000), silver moved very close to those recent highs.
And – as you may recall – silver’s outperformance of gold is a sell signal.
Also, gold’s failed attempt to rally above $2,000 is an invalidation of a breakout by itself and a sell signal.
Interestingly, the most recent intraday highs formed a head-and-shoulders pattern, and the dashed line that marks the current (at the moment of writing these words) price is actually the neck level of the pattern. So, given just a little more weakness, gold would be likely to decline by another $40 or so.
Finally, all the points that I made yesterday remain up-to-date. Even the ones about the HUI Index’s hourly chart and the specific analogy to 2008.
Still, do you know the saying that time is more important than price – when the time is up, the price will reverse?
The “weekly move” analogy was surprisingly accurate – gold’s final pre-slide rally took about a week. And that’s how much time the current rally took. This means that it’s likely to end today or shortly, anyway.
In fact, we see it even more clearly in the case of the HUI Index and its hourly chart.
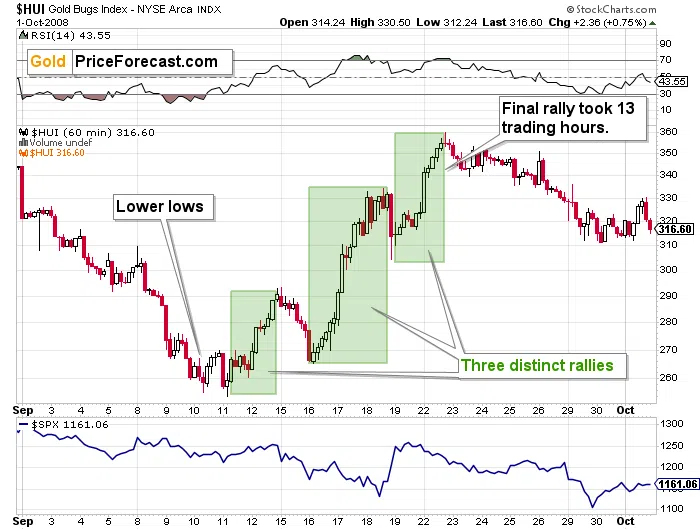
Here’s what the HUI Index (a proxy for gold stocks) did back in 2008 before sliding.
The decline ended with lower lows, and there were three distinct rallies. The final one took about 13 trading hours.
Here’s the current situation.

The decline ended with lower lows, and there were three distinct rallies. The final one took about 11 trading hours SO FAR.
That’s definitely “close enough” for the top to be in at this very moment. However, let’s keep in mind that history might not repeat itself to the letter but rather rhyme, so it could be the case that gold stocks move higher for several more hours before topping. Of course, I can’t rule out a situation in which miners move even higher even for several additional days, but this seems rather unlikely at this point.
Based on the historical analogies to two major crises, it seems that we are very close to the top in mining stocks, or we have already seen it.
The really interesting thing about yesterday’s session is that the HUI Index didn’t move to new highs, which means that the analogy in terms of the length of the third upswings is very much intact.
Moreover, after the final top, the HUI Index moved lower in a measured way initially, and we see the same thing right now.
Also, if we count the length of the entire rally, it took 53 hours in 2008. Right now, we are 49 hours after the bottom. So, it still seems that the top is in or at hand – also from this perspective.
Finally, since the interest rate decision and the following conference are tomorrow, the markets might be:
- Volatile in intraday terms (so one might as well ignore those moves)
- Ready to move in a meaningful manner only after the announcement and after the dust settles (the initial reaction might not count).
Consequently, instead of trying to guess what Powell is going to do or say, I think it’s best to wait until the dust settles and then see how the trends resume – and the trend in junior mining stocks is clearly to the downside, and the downside potential in it remains enormous.
What’s going to happen to the rates, in my opinion? I think we’re going to see a 0.25% hike. At the moment of writing these words, about 86% of market participants agree with this expectation. Some assume that there will be no hike. So, if there is one, it will be a bearish surprise to the latter – and something bearish for stocks, gold, and – most importantly – junior mining stocks.
Again, the enormous potential for the current short position in junior mining stocks remains fully intact. I can’t make any guarantees, but I expect the profits from this trade to be some of the biggest that we have ever achieved.
Thank you for reading our free analysis today. Please note that the above is just a small fraction of the full analyses that our subscribers enjoy on a regular basis. They include multiple premium details such as the interim targets for gold and mining stocks that could be reached in the next few weeks. We invite you to subscribe now and read today’s issue right away.
Sincerely,
Przemyslaw K. Radomski, CFA
Founder, Editor-in-chief