This rally in gold stocks has been huge. Was it extraordinary, though? Nope – it’s quite normal.
And since not that much changed on the markets from the short-term point of view, that’s what I’d like to focus on in today’s analysis. The analysis of the big picture in gold stocks.
The HUI Index chart below is key for today’s analysis. Remember – you can click on it to expand it.
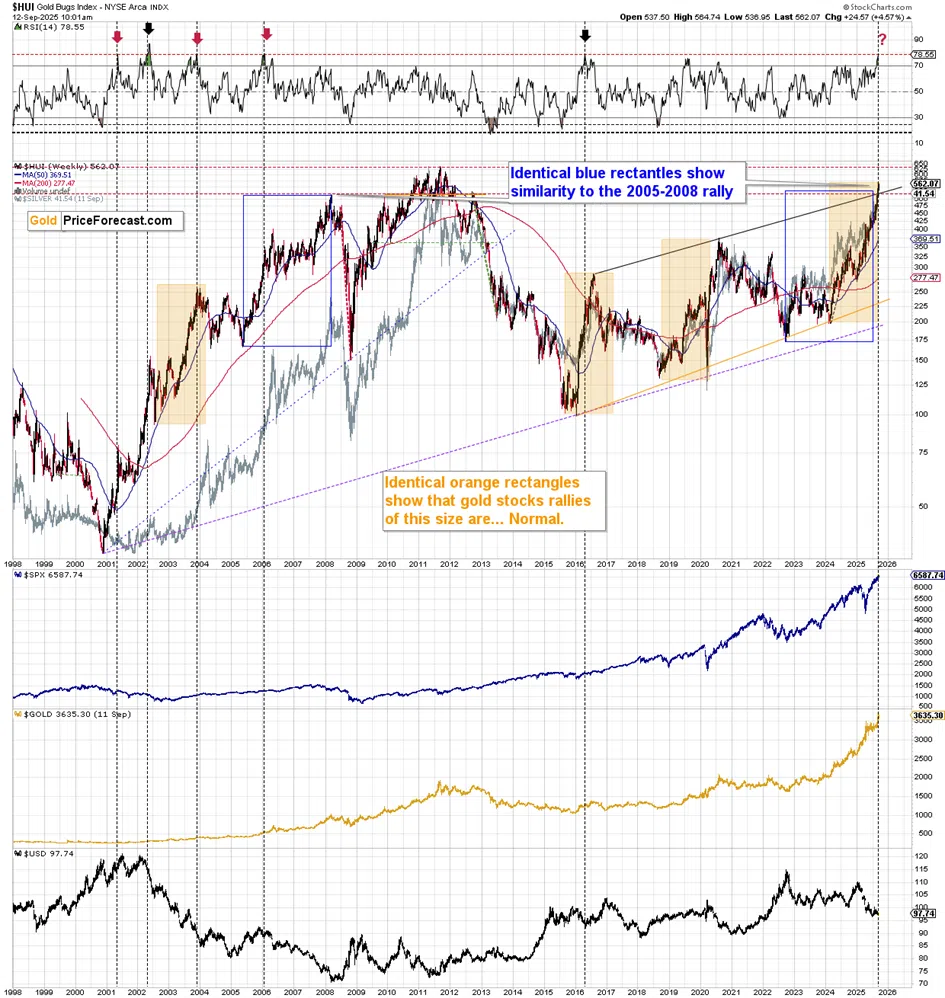
I previously wrote that the current rally is similar to what we saw in the previous medium-term rallies in the GDXJ, however this ETF didn’t show as significant alignment between both precious rallies as the HUI Index does.
The orange rectangles on the above chart are completely identical.
The rally that started in 2016 was faster and the rally that started in 2018 was slower than the current one. However, all three of them are practically identical in terms of size.
The similarity is uncanny, and this alone is a factor suggesting extreme caution when approaching gold stocks or the precious metals market in general.
This analogy doesn’t stop there. The size of this rally is almost (95%+) exactly like the 2002 – 2003 upswing (in relative terms).
That’s as far as the key part of the rally is concerned. However, if we take into consideration also the broader context, it turns out that the current situation is similar to the 2005 – 2008 rally, which I marked with blue rectangles.
The history doesn’t repeat itself to the letter, but in all above-mentioned cases the sizes of the moves are remarkably similar – especially that they are quite far from each other, which means that they formed under different geopolitical and economic circumstances. They did – however – shape based on the same human psychological mechanisms: fear and greed.
And you know what else? The RSI indicator (upper part of the chart) based on weekly prices moved to about 80, which happened only a few times in the previous decades.
In 3 out of 5 cases those were major tops, and in the remaining 2 cases those were interim tops that were followed by the final – major – tops.
How bullish is the current performance of gold stocks in all of the above? Not at all. “Bullish” refers to the future, not the past. We saw a major rally – that’s true. It doesn’t mean that it’s going to continue, though.
In fact… The HUI Index, GDX, and GDXJ are already down today despite gold being $14 higher. At the moment of writing these words, the GDXJ ETF is trading at $89.86 - it invalidated its move above $90, while the GDX invalidated its move above $70.
Thank you for reading today's free analysis.
Also, here’s something that might be of interest to you – we just posted the first performance report for all experts included in our Diamond Package (yes, I’m included as well).
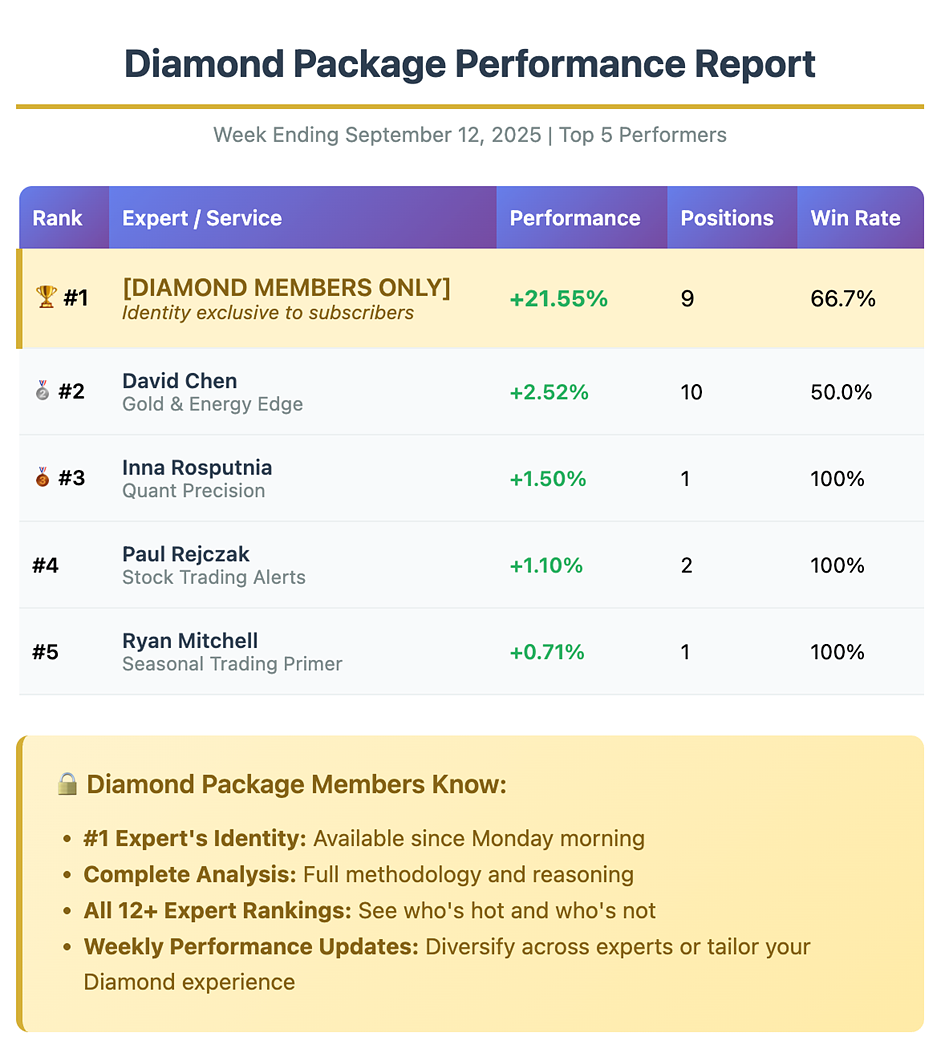
/Want to Know Who #1 Is?
Plus, get access to all expert analysis (12 premium newsletters + bonus material) when anyone could be next week's leader.
Reveal #1's identity + full rankings immediately
Thank you.
Przemyslaw K. Radomski, CFA
Founder, Editor-in-chief