Gold was trading sideways through the summer period, where we spotted a larger bearish running triangle formation within wave B, from where we were looking for a drop into wave C.
On September 18, we were tracking the final stages of the pattern. We specifically focused on subwave (E) with resistance around the upper triangle line, near the 61,8% Fibo. retracement at the 1950 area.
Gold 4H Chart From September 18
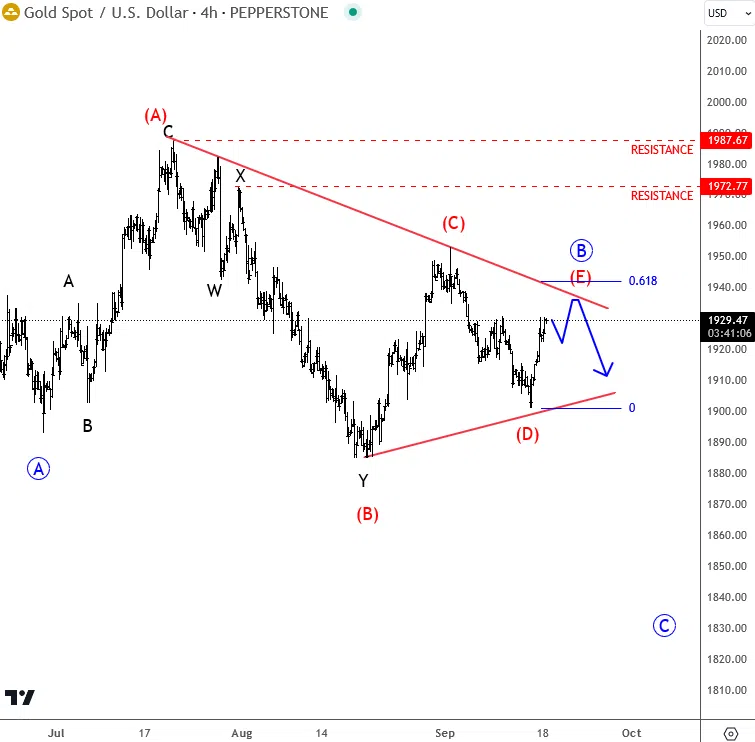
Well, a few days later, specifically on September 27th, gold came nicely down from the projected resistance as expected. Notice that the price also broke through the lower triangle line, thus confirming a bearish continuation within higher degree wave C. Wave C is a motive wave and should be completed by a five-wave cycle of the lower degree.
Gold 4H Chart From September 27

As you can see today, gold came impulsively down with a five-wave cycle for wave C. It actually means that wave C of an A-B-C correction can now come to an end, and it can ideally stop around the big 1800 support area when looking at the daily chart., Its a strong and ideal support at the former wave 4 area. If we see an impulse up from here, we will immediately call the low and start looking higher again, but for now, its a bit too early for any longs.
Gold 4H Chart From October 04

Gold Daily Chart From October 04

Grega
https://twitter.com/GregaHorvatFX
Love the Elliott Waves analysis? Visit www.wavetraders.com for more