


At the moment of writing these words, December gold futures trade near $3,970.
On Friday, they closed at $3,898.90, below the $3,920 target, after touching $3,879.30, a new 2026 low. Today, gold is rebounding with help from a weaker dollar and a slide in crude oil, while silver trades near $51.
Friday's close matters more than today's rebound, and here's why.
Gold Closed Below the $3,920 Target
Gold didn't stop at the target, and it closed the week below it.
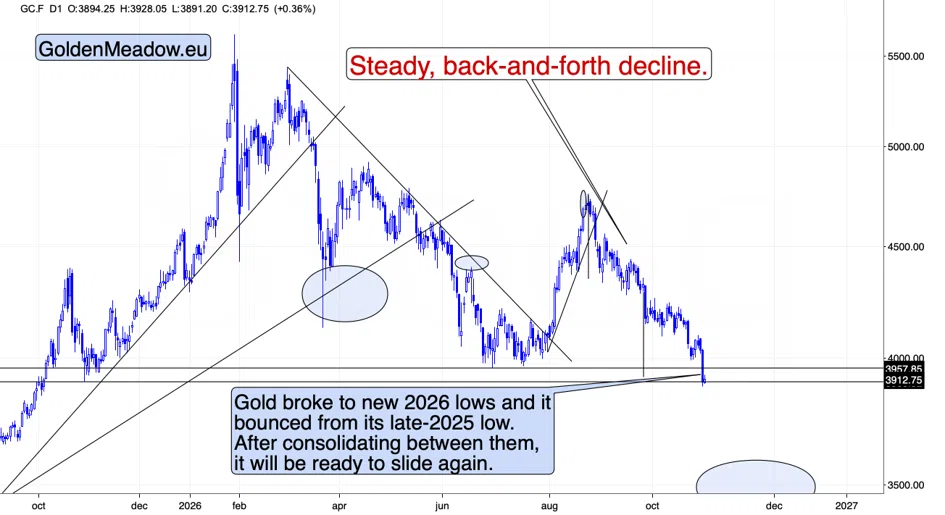
On October 29, I wrote: "The head-and-shoulders top on the above chart was completed, and its downside target is about $3,920." On Friday, gold futures fell $132.50, or 3.3 percent, and they closed $21.10 below this level.
The decline came on a day that should have supported gold. The 10-year Treasury yield fell to 4.92 percent, from 4.98 percent on Thursday, and the USD Index declined for the third session in a row. Lower bond yields reduce the cost of holding gold, which pays no interest, and a weaker dollar makes gold cheaper for buyers who pay in other currencies. The table below shows what should have helped gold on Friday and what gold did.
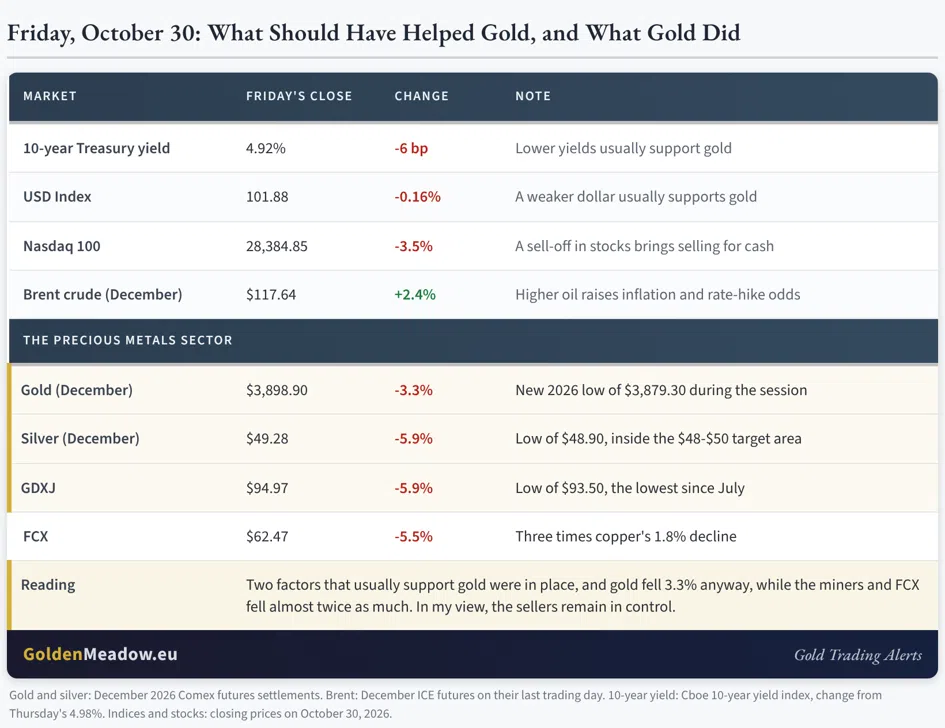
In the October 29 article, I also wrote: "Gold had reasons to rally today, and it took none of them." Friday brought more of the same, with a bigger decline. In my view, gold's failure to rally on supportive news is bearish information.
Why Some Breakdowns Run Without a Pause
After Friday's close, I replied to a question in the comments section of Gold Trading Alerts: "Given the daily close that we just got I think that the decline can continue without a meaningful consolidation - just like what we saw in 2013." Here's why some breakdowns run instead of pausing.
The first reason is stop-loss orders. Many traders who are long place their stop-loss orders slightly below obvious lows, such as gold's October 23 low of $3,989.10, or below round numbers, such as $3,900. When the price breaks below such a support level, many of these orders turn into sell orders at the same time, and the selling hits the market when buyers are stepping back.
The second reason is trend-following funds. Many of them buy and sell based on the price trend alone, using signals such as new highs, new lows, or moving averages. When gold makes new lows, their models tell them to cut long positions and add short ones, and they often do it over several days, not in a single session.
The third reason is margin calls. When prices fall fast, leveraged traders who bought on the way up get margin calls, and they sell to raise cash. This pushes prices lower, which leads to more margin calls.
In April 2013, all three worked together. On April 12, gold broke below its 2011-2012 lows, and the June contract fell 4.1 percent that day and 9.3 percent on the next trading day, from $1,564.90 to $1,361.10 in two sessions. There was no meaningful pause after the breakdown. On Friday, gold closed below both the October 23 low and the $3,920 target, which is the kind of setup in which this mechanism might work again.
Where Gold Is in the Scenario
In my gold price forecast for November 2026, published on Friday, I wrote: "With the first target reached, the next one is about $3,500." I also wrote: "Once gold tests about $3,500, I expect a rebound to more or less the current levels, with gold verifying $4,000 as resistance."
This places gold between the first target and the second one. The first target of $3,920 is behind us, and the next one is about $3,500. On the gold chart above, gold broke to new 2026 lows and bounced from its late-2025 low. In my view, after a consolidation between these levels, gold will be ready to slide again, and the consolidation might be quick, perhaps a 1-2-day event.
Today's rebound came with a weaker dollar and a slide in crude oil. WTI crude oil is down more than 6 percent, near $97, after Axios reported that President Trump told Prime Minister Netanyahu he wants to give diplomacy with Iran more time before considering new strikes. Lower oil eases the inflation pressure, which helps gold through the rate channel. In my view, the rebound is part of the consolidation, and it doesn't change the bigger picture.
The Week Ahead
This week brings several events with the potential to move rates, the dollar, and gold.
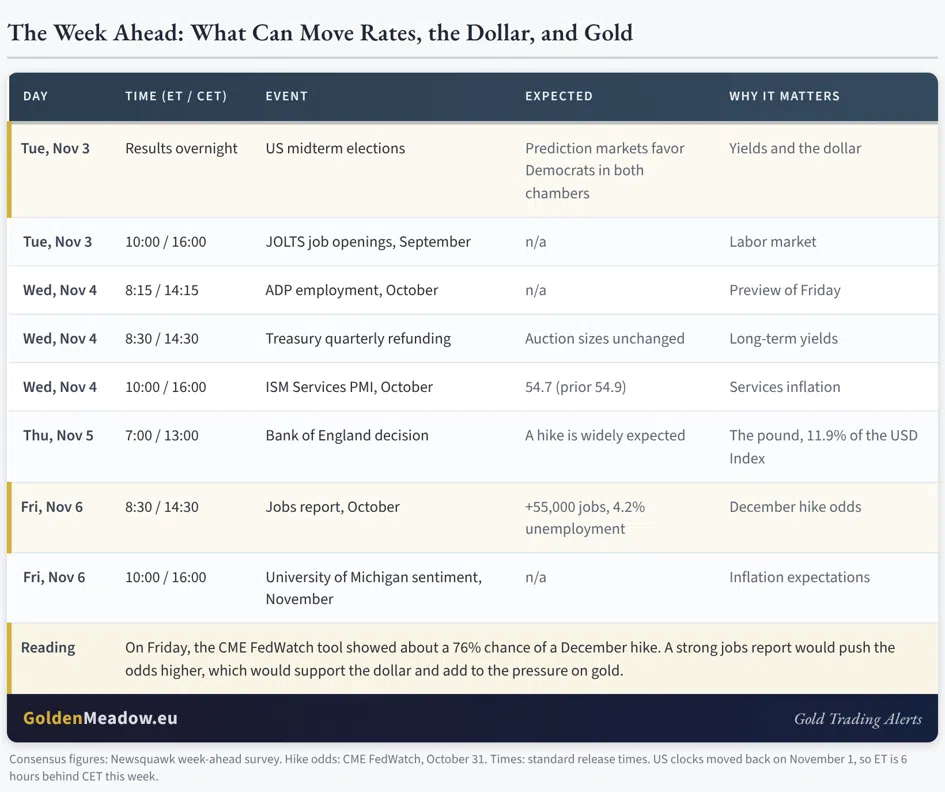
The midterms come first, on Tuesday. Prediction markets already give the Democrats high odds in both chambers, so a Democratic win alone wouldn't be a surprise. For gold, what matters is how the result moves Treasury yields and the dollar.
The jobs report comes on Friday, and economists expect 55,000 new jobs and an unemployment rate of 4.2 percent. The Fed's hawks spoke on Friday, as soon as the blackout period ended, and as of Friday's close, the CME FedWatch tool showed about a 76 percent chance of a December hike. Hawkish comments and a strong jobs report both support the case for higher rates, and in my view, this would add to the pressure on gold.
Where This Leaves Us
Gold closed below the $3,920 target on a day when yields and the dollar declined, and the miners fell almost twice as much as gold. In my view, the decline can continue toward about $3,500 without a meaningful consolidation, as it did in 2013, and today's rebound doesn't change this picture.
In today's Gold Trading Alert, I also moved the target for the junior miners lower. Several subscribers asked in the comments what the GDXJ would correspond to with gold at about $3,500, and I answered with the new level, the reasoning behind it, and the area where I think going long the miners might become justified from the risk to reward point of view. These details are reserved for my subscribers.
On Friday, $3,920 stopped being a target and became a level gold left behind.
Important note: the forecasts are up-to-date at the moment of their publication, we don’t guarantee updating them for free readers. We will, however, keep our premium subscribers updated at all times.
Thank you for reading the free version of today’s analysis. The premium version (Gold Trading Alert) includes more specific analysis of gold, silver, and mining stocks as well as profit-take levels for our positions, and subscribers also get the Leveraged ETF Calculator with up-to-date levels for leveraged and inverse funds. Diamond Members get to enjoy also over ten other premium publications at the fraction of their individual prices. If that might be of interest to you, I invite you to review our premium services. And if you’re not yet on it, I invite you to join our free gold newsletter today.
Thank you.
Sincerely,
Przemysław K. Radomski, CFA