There’s a war in Europe, and billions of dollars were printed, and gold is below its 2011 highs.
Between 2020 and now, quite a lot happened, quite a lot of money was printed, and we saw a war breaking out in Europe. Yet gold failed to rally to new highs.
In fact, gold is once again trading well below its 2011 high, which tells you a lot about the strength of this market. It’s almost absent.
There’s a war in Europe, and billions of dollars were printed, and gold is below its 2011 highs – in nominal terms! Adjusted for inflation, it’s much lower. And silver and gold stocks’ performance compared to their 2011 highs? Come on…
Truth be told, what we see in gold is quite in tune with what we saw after the 2011 top, and in particular, shortly after the 2012 top. We can also spot similarities between now and 2008. The long-term gold price chart below provides details.
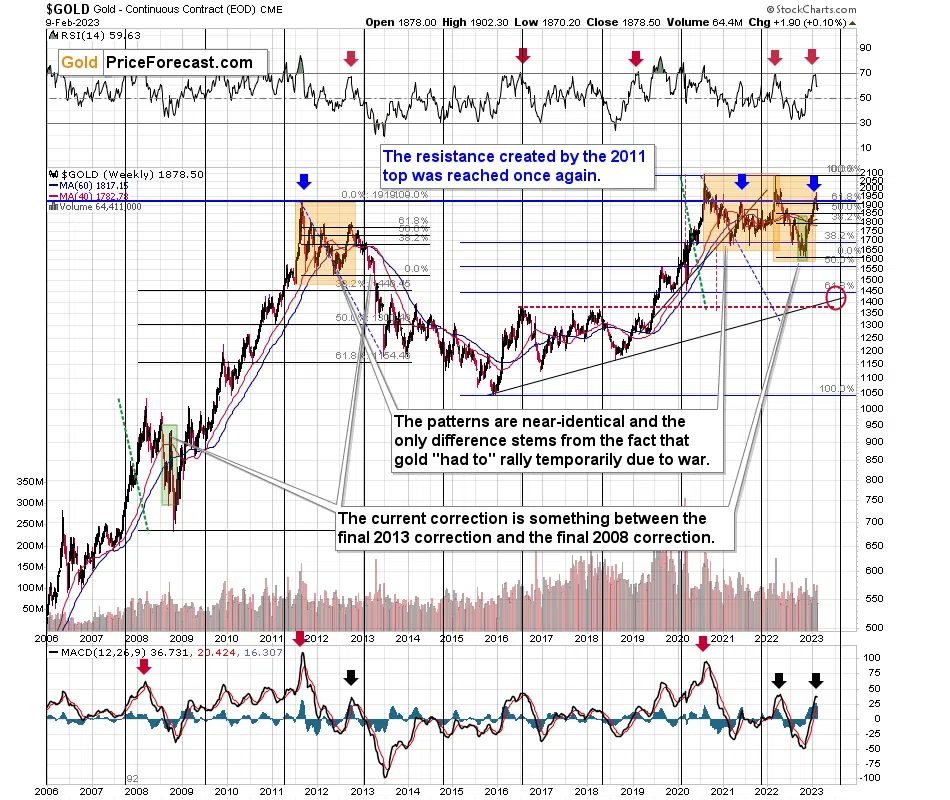
As I wrote a bit earlier, the key thing is that gold once again tried to move above its 2011 highs, but it once again failed to do so. It invalidated this breakout in one of the most bearish ways imaginable – with a weekly reversal.
This is an extremely important sell signal. I’m describing quite a few of those today, but this combination of fundamental and technical factors alone is a reason to prevent one from having a long position in gold right now (except for the insurance capital, that is).
That’s one thing. Another thing is that, given the major fundamental event that I already mentioned above (the war outbreak), it’s possible for the technical patterns to be prolonged and perhaps even repeated before the key consequence materialized. Similarly to the head-and-shoulders pattern that can have more than one right head, before the breakdown and slide happen.
In gold’s case, this could mean that due to the post-invasion top, the entire 2011-2013-like pattern got two major highs instead of one. Thus, the initial decline and the subsequent correction are pretty much a repeat of what we saw in 2020 and early 2021, as well as what we saw in 2011 and 2012.
The particularly interesting fact (!) about the correction that we saw after the 2011-2012 decline (the one that was followed by the huge 2012-2013 decline) is that during it, gold corrected slightly more than 61.8% of the preceding medium-term decline. Consequently, the current situation is just like what happened back then.
If all the above wasn’t bearish enough, please take a look at the reading of the RSI indicator based on the weekly price changes. It’s now just below 70, and guess where it was at the final top before the 2012-2013 slide? Yes, it was exactly there, too.
That’s also approximately where the RSI was at last year’s top.
The orange rectangles on the above chart represent the corrective upswings from approximately the previous local lows. There are two of them, and back in 2013, there was just one corrective upswing before gold truly plunged.
However, please remember that history doesn’t repeat itself to the letter – it rhymes. This means that two corrections instead of one are still within the scope of the similarity, especially since the first correction wasn’t as big as the 2008 one.
The current situation is truly special, as the rate hikes are something that we haven’t seen in a long time. The same goes for the level of concern about the inflation that’s “out there.” The latter implies that when faced with a decision about whether to fight inflation or help the economy, the Fed is likely to lean toward the former. That’s bearish for assets like gold.
Looking at gold from a short-term point of view, we see that it has indeed moved above the 61.8% Fibonacci retracement.

When the above happened, but before the invalidation of the move, I wrote that this would have been a bullish indication if it weren’t for the very bearish analogy to late 2012.
Particularly given that gold's RSI based on weekly closing prices is just below 70 and the RSI based on daily prices is well above 70. In fact, gold’s daily RSI is above 70 for the second time in a relatively short period, and that’s exactly what we also saw at the 2022 top.
What happened next? Gold pierced through its rising support line (on huge volume that confirmed the move!) and it invalidated the move above the 61.8% Fibonacci retracement.
History rhymed. And the next verse in that poem is very bearish.
Remember the feeling that was prevalent among gold investors and traders at the 2022 top, when it was trading above $2,000? The overwhelming bullishness? The feeling of invincibility? All the theories due to which gold just has to rally? It’s been quite similar recently.
These are emotions that accompany tops, whereas fear, disappointment, and despair accompany bottoms. It’s much easier to describe ignoring emotions in trading than to actually do it, but it’s my responsibility to remind you how it is, how it was, and what happened to the price of gold during similar times.
And it fell. Hard.
What does it tell you about the likely medium-term (next several months) future for the yellow metal?
That it doesn’t look good.
What could look good – in fact, amazing – is the result of being correctly positioned within this decline. Not all parts of the precious metals sector provide the same risk to reward opportunity, and there are counter-trend moves that provide extra opportunities. Investing in insights might be the best investment that one actually makes in this situation.
Thank you for reading our free analysis today. Please note that the above is just a small fraction of the full analyses that our subscribers enjoy on a regular basis. They include multiple premium details such as the interim targets for gold and mining stocks that could be reached in the next few weeks. We invite you to subscribe now and read today’s issue right away.
Sincerely,
Przemyslaw K. Radomski, CFA
Founder, Editor-in-chief