


[This analysis is exclusive to GoldenMeadow.eu and GoldPriceForecast.com.]
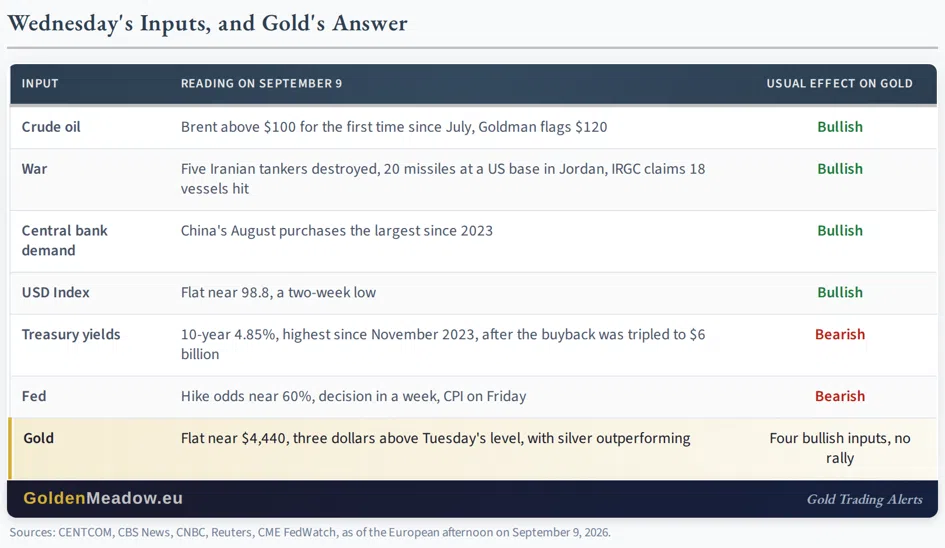
Brent crude traded above $100 today for the first time since July. The US destroyed five Iranian tankers on Tuesday night, Iran fired 20 ballistic missiles at a US base in Jordan in reply, the IRGC claims to have hit 18 vessels this morning, and the Treasury tripled its bond buyback to $6 billion and watched the 10-year yield rise to its highest level since November 2023 anyway.
Gold is up… three dollars.
The Cap Was Raised, And It Still Did Not Hold
On September 2, I wrote: "The enlarged buybacks do not even begin until September 9, and the yields they were designed to hold down have already moved past them."
Today is September 9, and the Treasury answered by tripling the operation: $6 billion of 10- and 20-year notes to be bought tomorrow, against the "at least $4 billion" promised on August 19. Yields rose within hours. The 10-year reached 4.85 percent, its highest since November 2023, the 20-year 5.31 percent, and the 30-year 5.30 percent. Part of the market had expected $7 billion or $8 billion and treated $6 billion as a disappointment, which is the problem with defending a price: the defense becomes the benchmark, and each operation has to beat the last one. Stanley Druckenmiller described the mechanism in his op-ed two weeks ago: "every rise in yields becomes a test of official resolve, and the operations must grow to survive the tests."
Treasury Secretary Bessent said Tuesday that the buybacks would make the market "get out of their fever dream and look at the facts."
The market looked, and it sold.
For gold, this matters because the August rally was built on the idea that the Treasury would cap yields and the debasement trade would carry the metal. The cap has now failed twice, once on the announcement and once on the execution, and gold's gain on the day the program went live is just three dollars.
Oil Through $100, Gold Flat
The escalation is real. CENTCOM destroyed four Iranian tankers in the Gulf of Oman and one near Kharg Island on Tuesday, bringing the count to ten in a week, and Iran answered overnight with 20 ballistic missiles at a base in Jordan, 18 of them intercepted, plus claimed attacks on two US destroyers, eight tankers, and ten "non-compliant" vessels in the strait. CENTCOM says no US warship was hit. The UK's maritime agency reports several merchant vessels on fire in the northern Gulf and the Gulf of Oman, Saudi Arabia struck back at the Houthis across Yemen, and Goldman now puts Brent above $120 in its upside scenario, with JPMorgan estimating $7 to $8 a barrel for each additional month of disruption.
Yesterday, I wrote: "The Iran war premium is in crude, in Treasury yields, and in gasoline at a Labor Day record of $4.15. It is not in gold."
It is still not in gold. One more item belongs in the same column: China's central bank reported its largest monthly gold purchase since 2023 for August, and the metal did not rally on that either. A market that fails to rise on oil above $100, ten tankers destroyed, and record official buying is not waiting for a bigger reason. It has been handed every reason and is declining to use them, which is what a market in a topping pattern looks like from the inside.
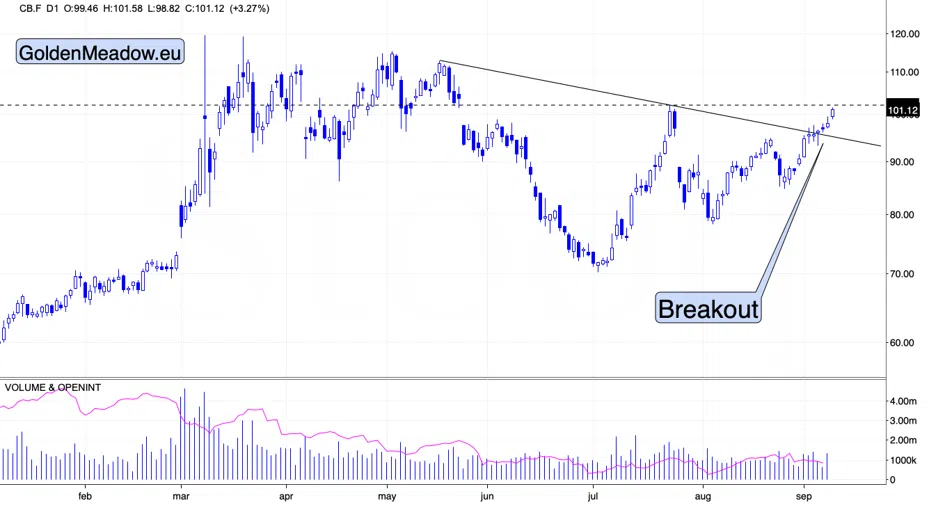
Meanwhile, crude oil moved above its July high.
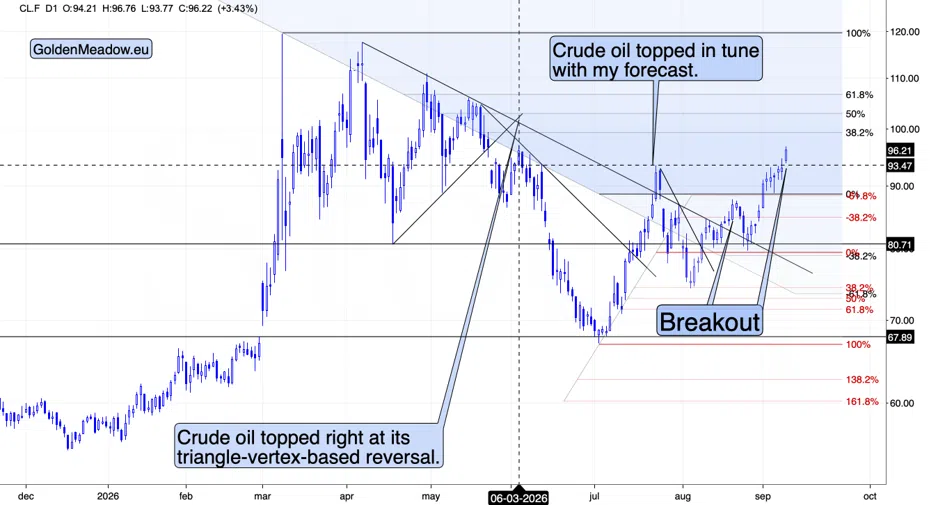
Remember – the medium-term impact of higher oil prices is extremely bearish
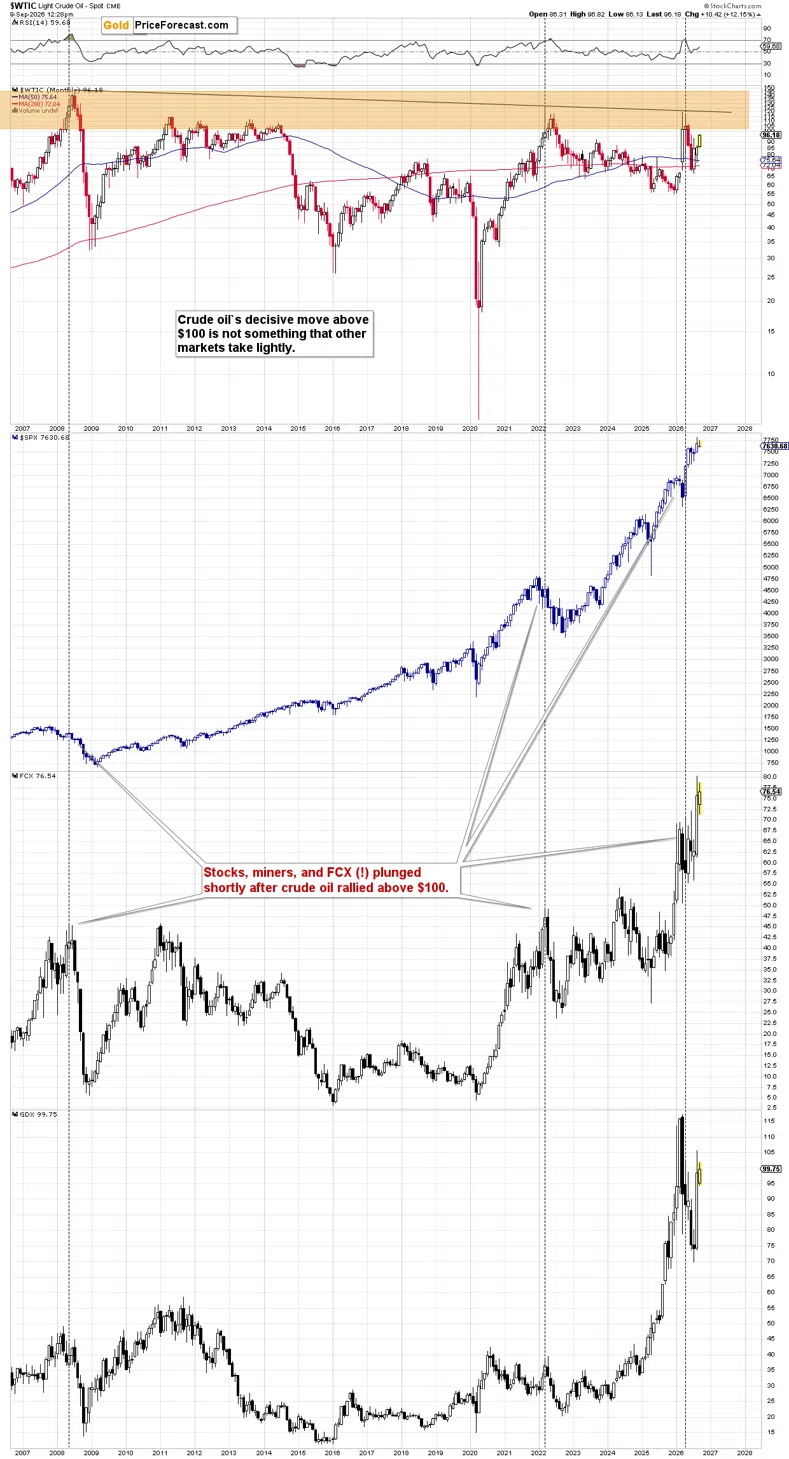
In particular, please consider the link between now and 2008. The GDX (bottom part of the chart) corrected after the initial slide and once this corrective upswing was over, THE decline started.
If the 2026 decline that we saw so far is the initial part – and that’s likely the case – then the next move down is likely to be truly huge.
The Right Shoulder
On Friday, I wrote: "Both consolidations could be the shoulders of a head-and-shoulders top formation. The target based on this formation would be close to $4,100."
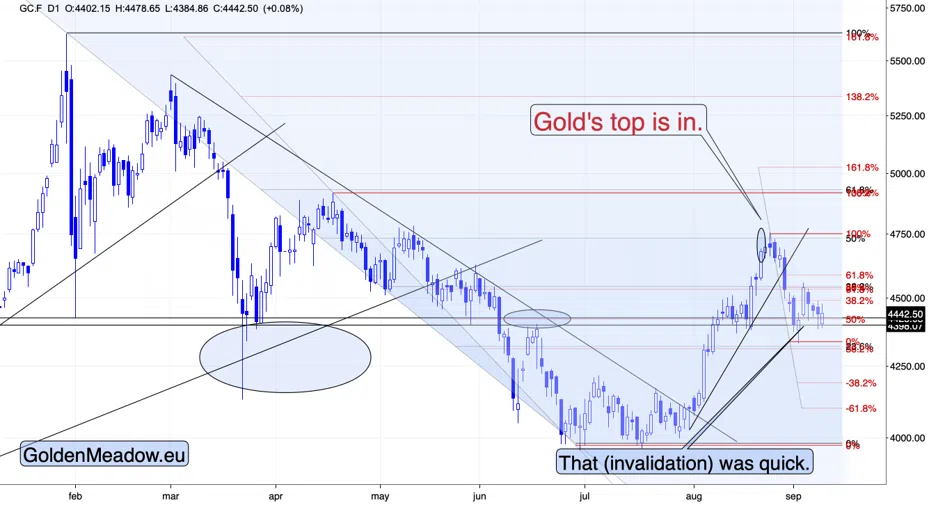
Today's session extends the right shoulder. Gold spent another day near $4,440, below the declining line it briefly crossed at the top, and the pattern is more visible with each session that fails to break above the shoulder's high. The neckline sits near $4,320, and a daily close below it would complete the formation.
The detail that matters today is the internals. Silver is up while gold is flat, and the miners are up a little. Silver outperforming gold on a short-term basis, inside a consolidation, with gold itself unable to rise, is the sequence I described on September 3: "silver stronger than gold has 'watch out, it's a fake rally' written all over it." Today's version is smaller, but it is the same signature, and it tends to mark short-term tops rather than bottoms.
Stocks – This Could Be Huge
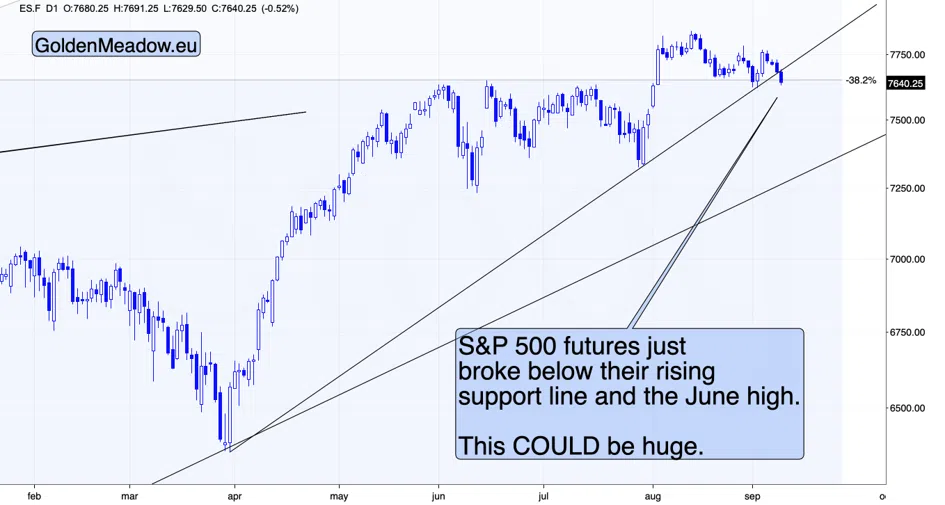
As you can see on the above chart – we have a major breakdown.
If stocks close today’s session below both: rising support line, and the June high, things could get very volatile quickly. This would likely have bearish implications also for the precious metal sector.
For now, it’s a big “if” as stocks provided us with multiple fake breakdowns before, but given how the AI bubble is developing, one of them is likely to be true. And one is enough.
Thank you for reading the free version of today’s analysis. I encourage you to subscribe for the premium version today. If you’re not ready to subscribe yet, I encourage you to sign up for my free gold newsletter now.
Thank you.
Sincerely,
Przemysław K. Radomski, CFA