Long-term charts provide insights.
My recent gold price forecast for August 2025 included a detailed analysis of the current analogy between now and the 2011 top, and this link remains up-to-date, especially with regard to mining stocks’ strength. Consequently, in today’s analysis, I’d like to focus on the two key things:
1. What gold is doing – especially compared to the situation in the USD Index.
2. How far is too far in the case of mining stocks.
Let’s start with the latter, as given today’s early upswing in GDX and GDXJ, it seems that this might be what you’re most interested in.
In short, THIS – the current prices – is the “too far” in case of both mining stock ETFs.
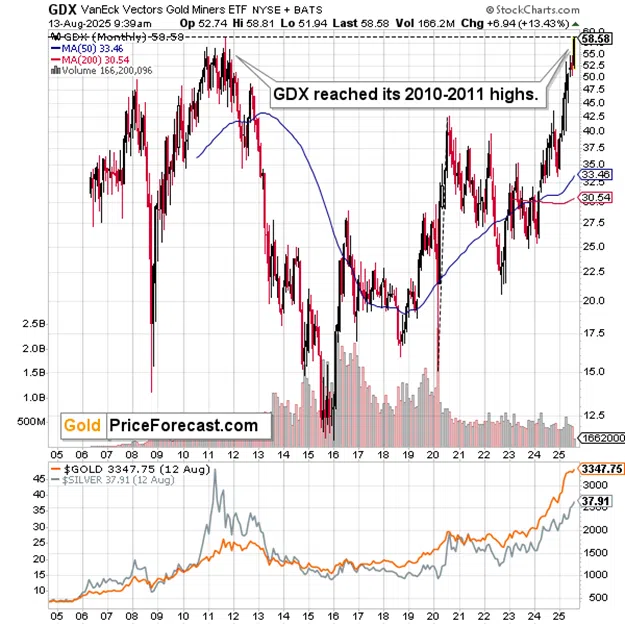
The GDX ETF just moved to its all-time high. The 2011 high was $58.93. This month’s intraday high is $58.81, and several extra cents could be added to the ETF value any minute now.
This is an extremely strong resistance level that is being reached here, and it’s very unlikely that the market would be able to push through it without declining first.
Sure, breakouts happen. But let’s keep in mind all the points that I’ve been making in the previous analyses – about the link to 2011, as well as the situation in the USD Index – but we’ll get to that shortly.
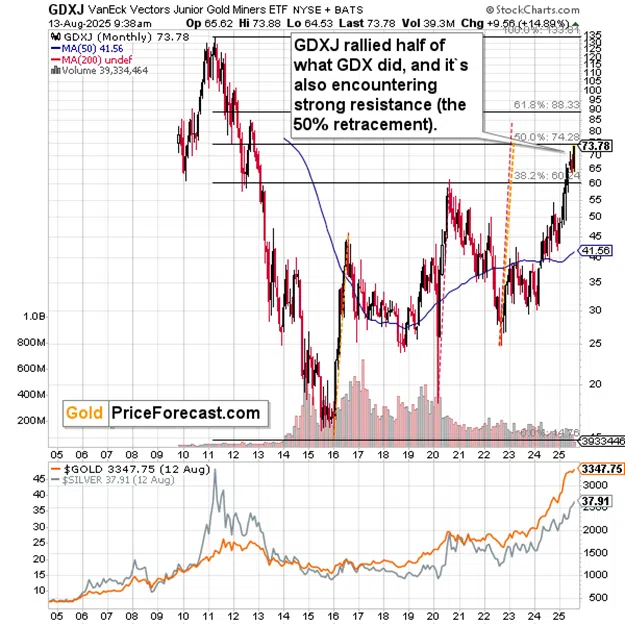
While the GDX ETF is reaching its 2011 top, the GDXJ is reaching its 50% retracement based on the 2011 – 2016 decline.
Quoting my August 7 comments on the above chart:
“This is as red-alert situation as it gets.
Even if GDX was to rally another $1 here and reach its 2011 high, it would create an incredibly bearish setup for a massive decline in the following days/weeks.
Back in 2011, it took just several days for GDX to slide $10. In case of GDXJ, this could amount to a $15 decline. “
Why would the GDXJ be likely to decline more?
Because it’s been weaker the whole time, and even now, as the GDX moved to new highs, GDXJ didn’t.
Let me be frank - on a very short-term basis, we could still see some temporary gains – up to $59 in GDX (the 2011 high) and perhaps even $74 in GDXJ (the 50% retracement), but neither of them has to be reached for the declines to start.
(…)
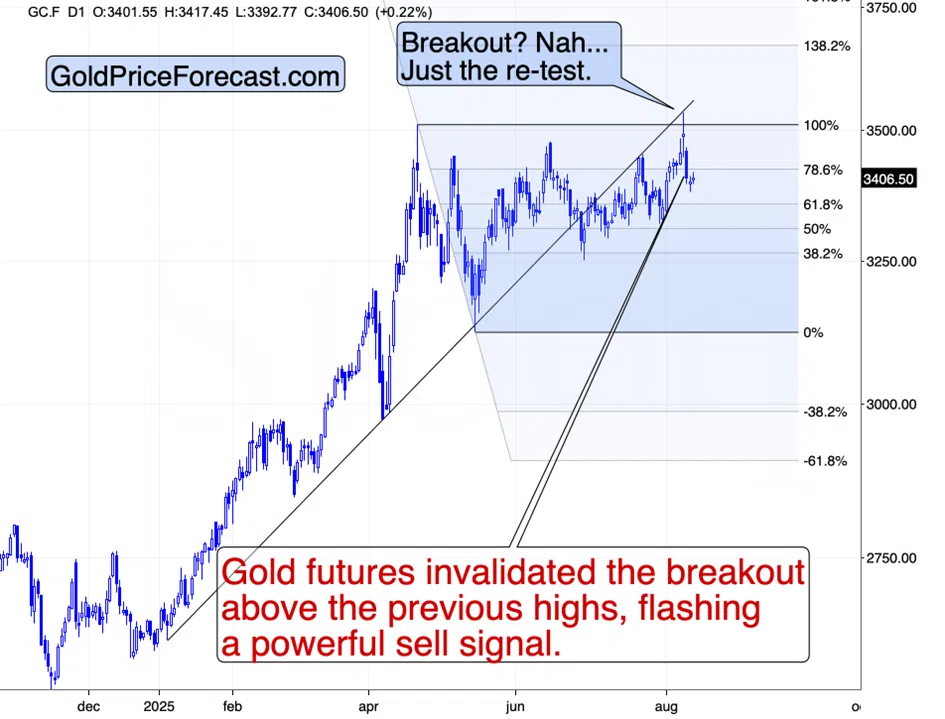
Especially that gold once again encountered its previous highs and it once again moved above its 78.6% Fibonacci retracement level.”
Indeed, the moves to $59 and $74 in GDX and GDXJ, respectively, are taking place, and it likely means that the final tops are in or that they are being formed as I’m writing this (or as you are reading this).
And speaking of gold’s 78.6% Fibonacci retracement – I previously commented that the breakout above this level was likely to be invalidated, and that’s exactly what happened.
What’s truly remarkable, however, is that during the last several days, gold first declined sharply when the USD Index moved higher, and when the USD moved back down, gold almost completely ignored it.
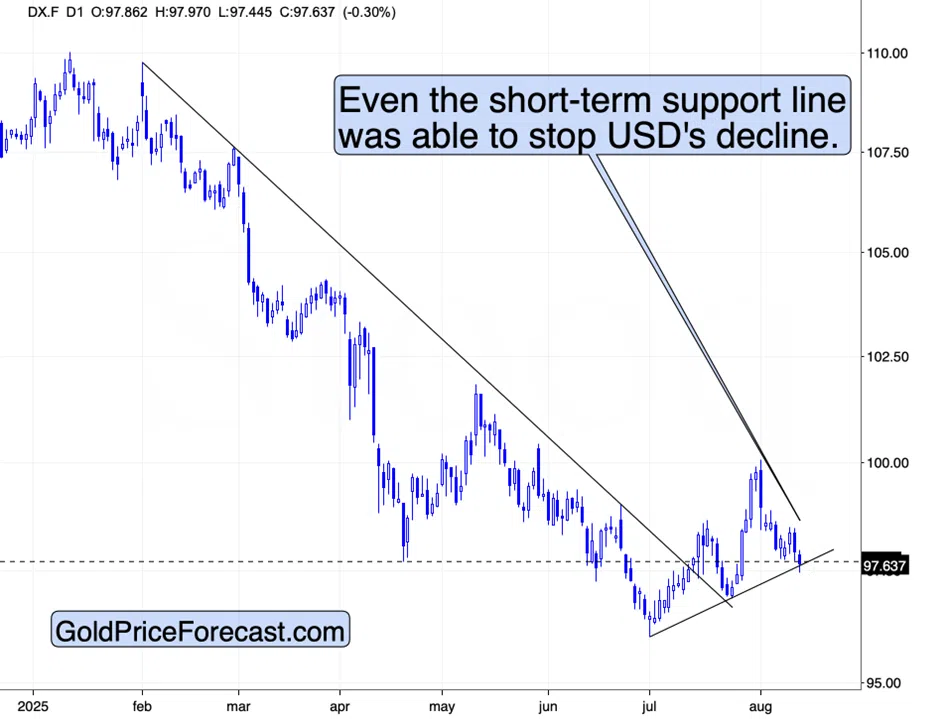
This is gold, pretty much screaming into our ears that it wants to decline and that it wants to decline soon. This kind of relative performance is not something we see often.
Sure, every now and then, gold is weaker or stronger relative to the USD, but not to this extent. This is rare, and this is meaningful.
Combining this with the very strong similarity to the 2011 top and the extremely strong resistance that the mining stocks just reached, points to only one likely scenario – bigger declines in the following weeks.
Still, IF the unlikely happens and GDX confirms its breakout above its previous highs, my subscribers are prepared to buy specific four gold stocks that would likely provide the biggest bang for the buck.
New Service Launch – Gold & Energy Edge by David Chen
Today we're publicly launching Gold & Energy Edge, our newest systematic trading service focused on precious metals, energy stocks, and commodities. Diamond Package members received early access last week (without a price increase), and now it's available to everyone.
What Makes Gold & Energy Edge Unique:
✅ "Systems Over Stories" Philosophy – Focus on mathematical price relationships, not market narratives
✅ Systematic Signal Generation - At least 3 high-probability setups per week with precise entry/exit levels
✅ Proven Risk Management - Every signal includes 2:1 profit-to-risk ratios and clear cancellation points
✅ 1-2 Week Timeframes - Perfect for systematic opportunities without day-trading complexity
✅ Both Long and Short - Opportunities in trending and declining markets with mathematical precision
Meet David Chen:
David brings over 15 years of systematic trading experience, applying proven mathematical frameworks, including insights from Charles L. Lindsey's 30-year Trident methodology, combined with his own proprietary research. His approach focuses exclusively on what markets are actually doing through data-driven analysis.
My Personal Comment:
The system that David is using is straightforward in application, and I’ve seen it work before I agreed to for this service to be launched on Golden Meadow®. The focus is on 1-2 week moves, which is much short-term timeframe that I’m focusing on. If you’re interested in supplementing your approach with more short-term trades – this service might be worth exploring.
Thank you.
Przemyslaw K. Radomski, CFA
Founder, Editor-in-chief