The FOMC minutes’ malicious message highlights why the gold price should confront more downside in the months ahead.
While the gold price has been whipsawed in 2022 by investors’ manic mood swings, the latest bout of optimism pushed the yellow metal above its October highs. However, with the FOMC releasing the minutes from its Nov. 1-2 monetary policy meeting on Nov. 23, the results were highly bearish for gold, silver and mining stocks.
On the one hand, the report stated:
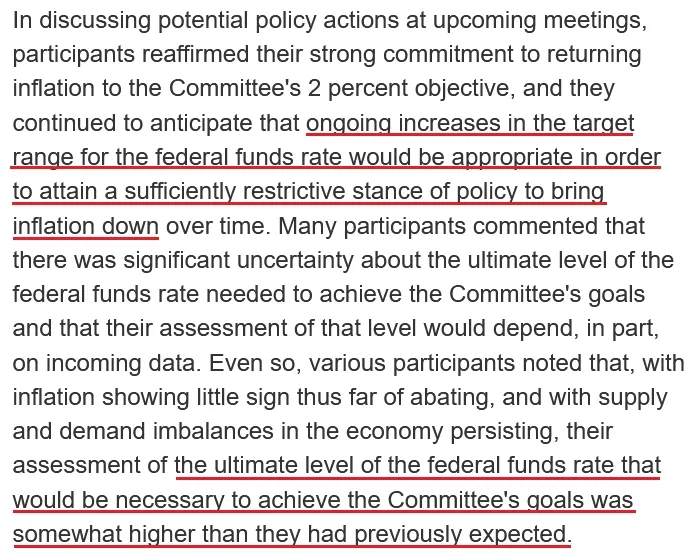
“A number of participants observed that, as monetary policy approached a stance that was sufficiently restrictive to achieve the Committee's goals, it would become appropriate to slow the pace of increase in the target range for the federal funds rate. In addition, a substantial majority of participants judged that a slowing in the pace of increase would likely soon be appropriate.”
On the other hand, while the crowd is so desperate for a dovish pivot that a “slowing in the pace” of rate hikes is the new rate cut, the reality is that the peak U.S. federal funds rates (FFR) should be “somewhat higher than they had previously expected.”
Please see below:
 Source: U.S. Fed
So, while I warned throughout 2021 and 2022 that unanchored inflation would prove highly problematic, the consensus still underestimates the challenge of reducing the metric to 2%. As a result, the recent rally across risk assets has been driven by hope, and disappointment should reign when reality returns.
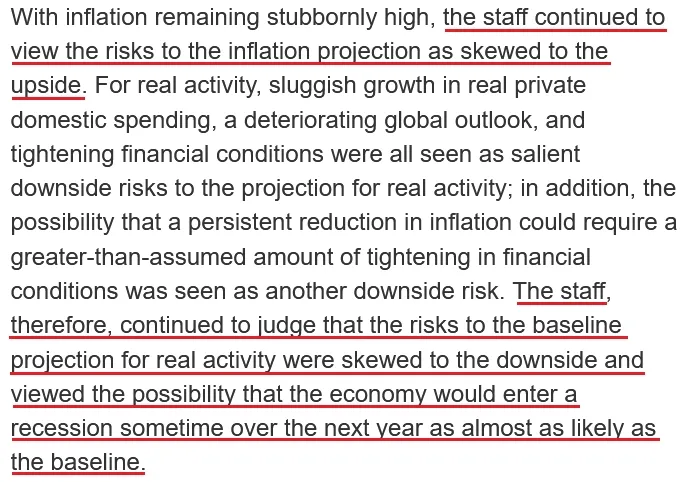
To that point, while I’ve noted that every inflation fight since 1954 has ended with a recession , Fed officials made it their near “baseline” view that the U.S. economy “would enter a recession sometime over the next year.”
Please see below:
 Source: U.S. Fed
As such, while bullish seasonality has Wall Street in the Christmas spirit, a higher peak FFR and a likely recession are profoundly bearish. Furthermore, while the crowd will note (and I agree) that growth, employment and consumer spending have remained resilient, they don’t realize that a sharp decline in all three is required to curb inflation.
In a nutshell: the longer consumer spending fuels GDP and wage growth, the higher the peak FFR when it’s all said and done. Remember, the Fed needs higher unemployment, weaker growth and lower consumer spending to reduce inflation, and we’re nowhere near that.
For example, the Atlanta Fed’s fourth-quarter real GDP growth estimate is bullish for the FFR. The report stated on Nov. 23:
“The GDPNow model estimate for real GDP growth (seasonally adjusted annual rate) in the fourth quarter of 2022 is 4.3 percent on November 23, up from 4.2 percent on November 17. After recent releases from the U.S. Census Bureau and the National Association of Realtors, the nowcast of fourth-quarter real gross private domestic investment growth increased from 0.4 percent to 1.0 percent.”
Please see below:
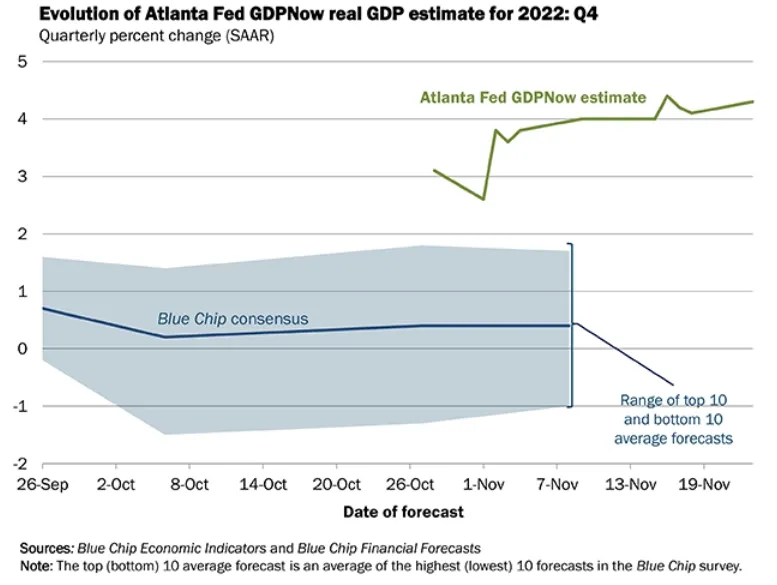
To explain, the green line above tracks the Atlanta Fed’s Q4 real GDP growth estimate, while the blue line above tracks the Blue Chip consensus estimate (investment banks). If you analyze the right side of the chart, you can see that the green line is far from levels that support a dovish 180.
Therefore, the price action materially contrasts the fundamental realities that should confront risk assets in the months ahead. With inflation still highly problematic and Fed officials continuing to increase their peak FFR projection, our previously out-of-consensus 2023 estimate of 4.5% to 5.5% will likely prove too low. Thus, don’t be surprised if inflation proves more troublesome than investors expect.
Is the Silver Price Approaching a Bearish Arc?
Teaser:
With liquidity-fueled assets underperforming the S&P 500, will the silver price be the next shoe to drop?
Article:
As the S&P 500 continues to seek higher ground, bullish seasonality has the crowd misreading the Fed’s intentions and the overall fundamental backdrop. Furthermore, with the price action beneath the surface also highly bearish, it’s an ominous sign when high-beta assets become laggards.
Please see below:
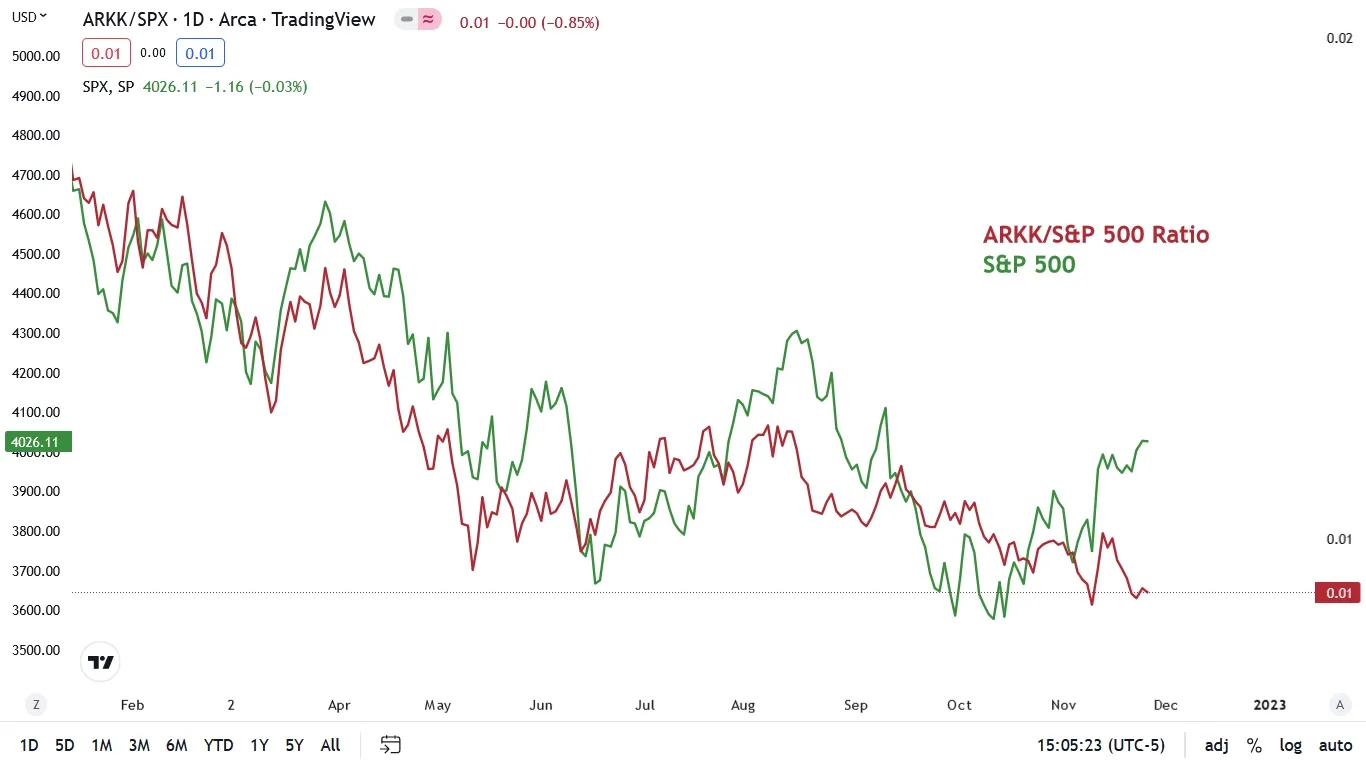
To explain, the green line above tracks the S&P 500, while the red line above tracks the ARK Innovation ETF (ARKK)/S&P 500 ratio. If you analyze the relationship, you can see that when the S&P 500 rises and falls, the red line often follows suit, which means the ARKK ETF often outperforms and underperforms the S&P 500 when the index rallies and declines.
In a nutshell: the ARKK ETF is a high-beta asset that’s more volatile than the S&P 500, and its movement is similar to how the silver price often rises and falls by more than the gold price during periods of optimism and pessimism.
However, if you turn to the right side of the chart, you can see that the S&P 500’s recent rally has culminated with the ARKK ETF materially underperforming (red line declining). As a result, it’s bearish when despite the narrative of an imminent Fed pivot, the behavior of liquidity-fueled stocks signals the exact opposite.
To that point, with the silver price often moving in close contact with the ARKK ETF since the Russia-Ukraine rally ended, new lows for the latter could have drastic implications for the former.
Please see below:
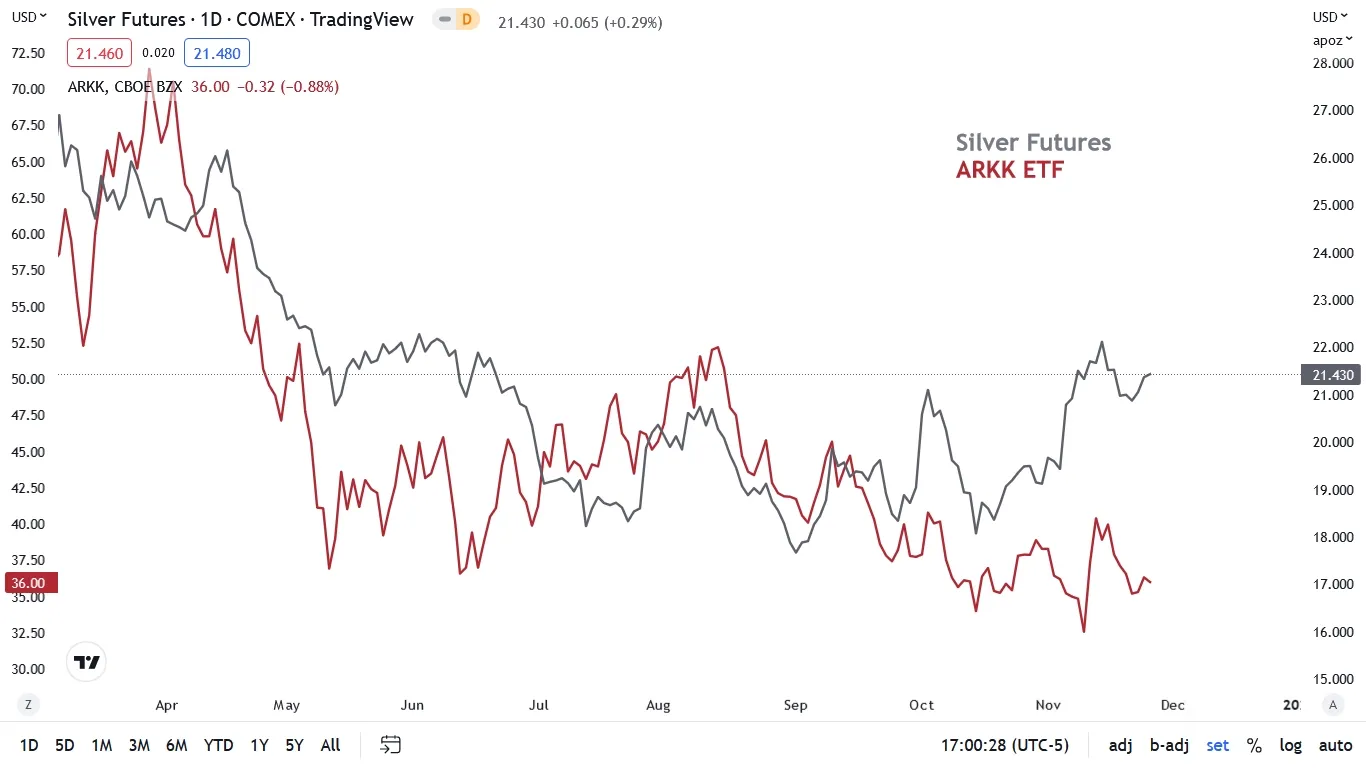
To explain, the red line above tracks the ARKK ETF, while the gray line above tracks the silver futures price. If you analyze the relationship, you can see that when liquidity-fueled stocks suffer, silver often exhibits similar weakness.
But, the large gap on the right side of the chart is reminiscent of silver’s outperformance in May and June. Yet, it wasn’t long before the silver price declined dramatically and the two lines reconnected once again.
So, while the white metal has showcased strength recently, the optimism is unlikely to continue if the ARKK ETF can’t catch a material bid. Moreover, with the Fed on a hawkish warpath to curb inflation, the S&P 500 and the ARKK ETF are overvalued relative to the fundamental backdrop that should confront stocks in the months ahead. As such, the silver price should also suffer when reality returns.
Wrong for Too Long
While I noted above that the Atlanta Fed’s Q4 real GDP growth estimate remains resilient, it’s only one-third of the fundamental equation that supports a higher FFR, real yields and USD Index. However, with consumer spending and employment also highly elevated, the lack of demand destruction should haunt the pivot bulls over the medium term.
For example, I noted previously that U.S. retail sales materially outperformed expectations in October; and with online Black Friday sales hitting a record $9.12 billion according to Adobe Analytics, the strength came on the back of a record $5.29 billion in consumer spending on Thanksgiving Day.
Consequently, while I warned for many months that demand was much stronger than the consensus realized, Americans’ ability and willingness to spend should make the Fed’s inflation fight one of attrition.
Please see below:
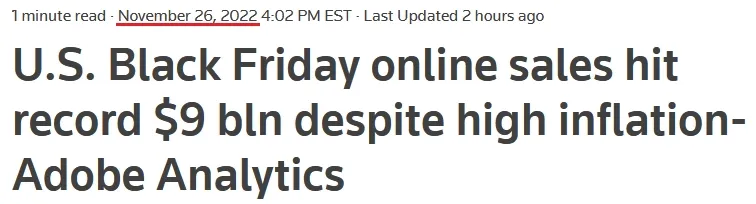 Source: Reuters
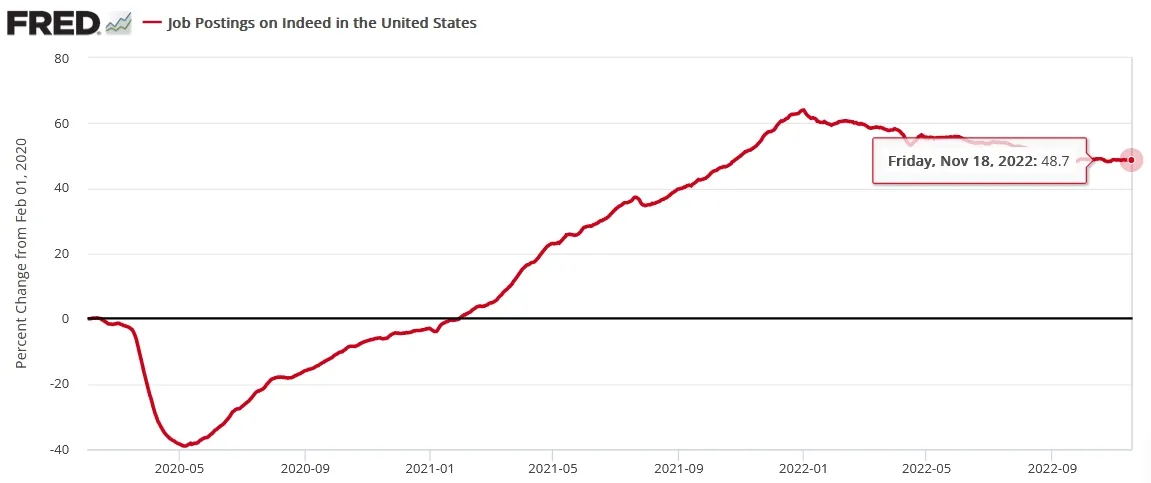
As for employment, Indeed updated its job postings data on Nov. 22; and with U.S. employment opportunities still 48.7% above their pre-pandemic baseline (for the week ending Nov. 18), little has been done to cool the U.S. labor market. As a result, until the red line declines substantially, wage and output inflation should remain elevated.
Please see below:
Likewise, S&P Global released its U.S. Composite PMI on Nov. 23. The headline index declined from 48.2 in October to 46.3 in November, and the deceleration was “the sharpest since August and among the quickest since 2009.”
However, the report added:
“In line with subdued demand, firms increased their workforce numbers only marginally in November. Hiring reportedly continued as firms tried to fill open vacancies for skilled workers, but the non-replacement of leavers (in an effort to cut costs) weighed on employment growth.”
So, please note that a marginal increase in employment is bullish for the FFR. Remember, the Fed needs the U.S. labor market to slow materially to reduce record wage inflation; and if U.S. firms are still increasing their headcount, the supply/demand imbalance has not been rectified, so a much higher FFR is required to normalize labor demand.
Also, while the consensus believes that a Fed pivot is forthcoming in 2023, the reality is that a recessionary plunge in growth, employment and consumer spending is required to make that hope a reality.
However, with Americans flush with cash and labor demand pushing up wages, the more the Fed slow rolls the FFR, the longer demand (and inflation) will persist. Consequently, the crowd doesn't realize that there is no easy way out of this conundrum, and I've warned repeatedly that despite investors' yearning for an unrealistic outcome, the Fed has two choices:
- Continue to raise the FFR, curb inflation and cause a recession.
- Pause rate hikes to stimulate growth and wait for inflation to cause an even worse recession.
Thus, while the Fed may aim for the perfect outcome, once inflation becomes unanchored, it’s nearly impossible to normalize the metric without causing a recession; and if they preach patience, inflation festers and eventually creates a worse recession. Therefore, while investors believe the Fed can achieve something that no committee has since 1954, history suggests otherwise.
S&P 500 Narratives
While the crowd makes it seem like a 50 or 25 basis point rate hike is the new dovish pivot, the reality is that higher interest rates are profoundly bearish for risk assets. For example, when risk-free assets offer higher yields, they reduce the incentive to purchase securities that could experience capital losses. Then, money flows from stocks, bonds (some), commodities, etc., to cash, as risk assets re-price to reflect a higher interest rate environment.
So, while prophecies of a new bull market may percolate as investors attempt to orchestrate a Santa Clause rally, no bear market since 1973 has ended without the Fed cutting interest rates.
Please see below:
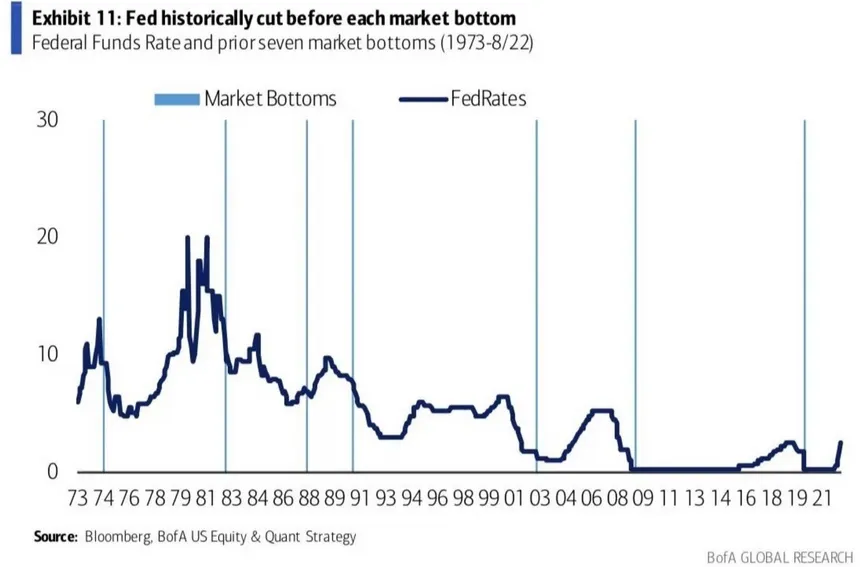
To explain, the dark blue line above tracks the FFR, while the vertical light blue lines represent stock market bottoms. If you analyze the intersections, you can see that rate cuts occur before the market bottoms. Now, I’ve noted previously that the first rate cut often doesn’t mark the final bottom, but it means the trough is likely to arrive sooner rather than later.
Yet, the Fed is nowhere near cutting interest rates. Remember, officials are talking about reducing the pace from 75 to 50 to 25 basis points (which has always been expected), and that’s still profoundly hawkish. Likewise, with growth, employment and consumer spending still uplifted, the idea of rate cuts is ridiculous. As a result, history shows that the S&P 500 is likely far from a medium-term bottom.
As further evidence, I’ve repeated that every inflation fight since 1954 has ended with a recession; and since no bear market since 1929 has ended before a recession began , a confluence of historical data materially contrasts the bullish narrative.
Please see below:
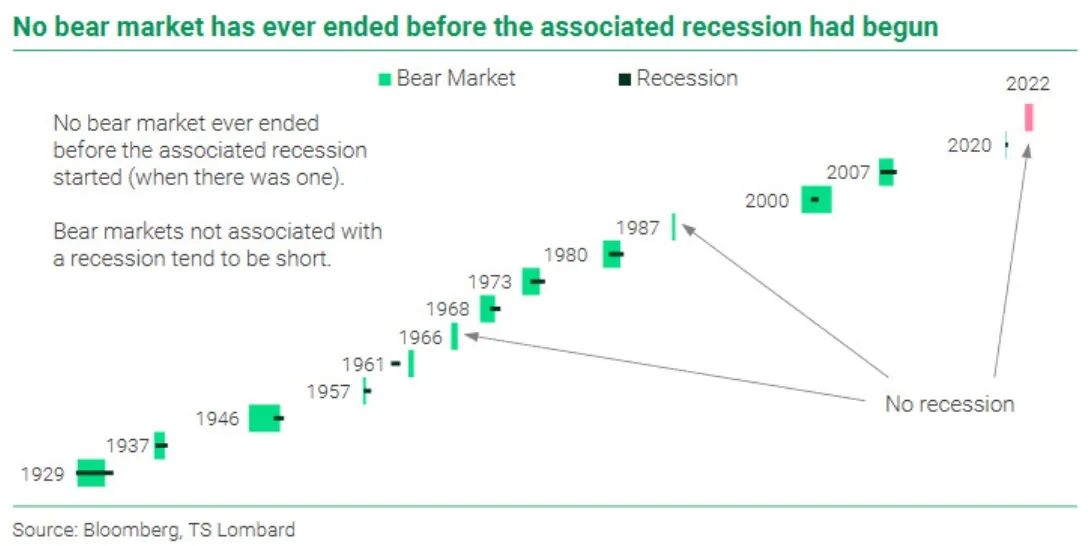
To explain, the light green blocks above represent bear markets and the horizontal dark green lines represent recessions. The data shows that bear markets suffer more downside when recessions hit, while the gray arrows show that bear markets without recessions are often short-lived.
Furthermore, since a recession hasn’t occurred in 2022, the bulls can point to 1966 and 1987 as similar analogies. However, with significant economic weakness poised to materialize as the Fed battles inflation, even the FOMC thinks a 2023 recession is highly likely. As such, this bear market should have plenty of room to run, and the GDXJ ETF often suffers mightily when the S&P 500 declines.
The Bottom Line
With the FOMC minutes providing another reality check, the dovish pivot is dead, and officials consider a recession their near base case. Moreover, when we connect the dots between inflation, recessions and the performance of the S&P 500 during these fundamental backdrops, the medium-term outlook is profoundly bearish.
Therefore, while gold, silver and mining stocks have benefited from the recent sentiment shift, the fundamentals have not changed: the Fed needs tighter financial conditions to curb inflation, which is bullish for the FFR, real yields and the USD Index; and with liquidity-fueled assets like the ARKK ETF struggling to find buyers, it’s relatively poor performance is likely a warning sign of what lies ahead.
In conclusion, the PMs were mixed on Nov. 25, as mining stocks ended the day in the red; and while the USD Index and U.S. Treasury nominal and real yields continue to consolidate, the pauses are normal occurrences within uptrends and should culminate with higher highs over the medium term. As a result, the PMs should head in the opposite direction.
Alex Demolitor
Precious Metals Strategist