We’re stepping into a market that just made a decision - but not the final one.
The dollar hit resistance and rolled over, while gold and silver followed through on bearish scenarios we’ve been tracking. But here’s the twist: short-term signals are starting to push back. So, what we’re seeing now isn’t just continuation… it’s tension. And tension is where the best trades are born.
USD Index (DX.F) : The Rejection That Changes the Game
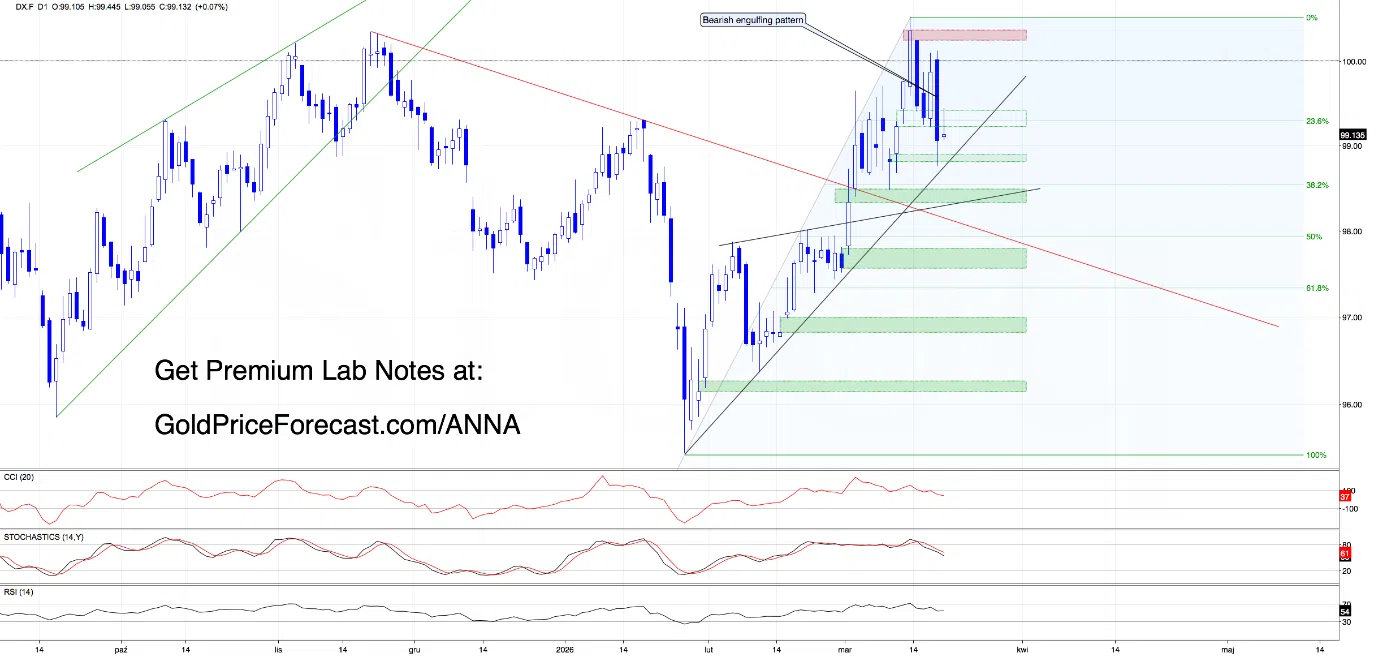
Let’s start this section with the Tuesday’s quote:
“(…) If that scenario plays out the next logical move would be a corrective bounce (B / wave 2) targeting at least the 100 zone (psychological + 61.8% Fibonacci retracement).
However, this is where things will get decided:
· reclaiming 100-> opens the door toward ~100.25 (78.6% Fib)
· rejection below-> confirms continuation lower
· (…) Failure to reclaim yesterday’s gap brings sellers back in, opening the path toward: 98.90 (…)”
From today’s perspective, we see that things played out almost exactly as expected.
Bulls managed to push the dollar into the resistance zone we’ve been watching… but that’s where the story ended. Momentum faded, and just like that, the market flipped.
What we’re left with now is a clean bearish engulfing pattern on the daily chart, sitting right at the psychological 100 level, and that’s not just a pattern, that’s a statement.
At the same time, yesterday’s price action gave us more clarity through the Elliott Wave lens. What looked like a potential B wave now strongly points to being wave 2, which opens the door for a much more aggressive move to the downside in the future.
From the daily perspective, bears now have the upper hand:
- strong bearish candle at resistance
- loss of the first bullish gap (reinforced by 23.6% Fibonacci retracement)
- sell signals from indicators
But when we zoom in to H4… the story softens a bit.
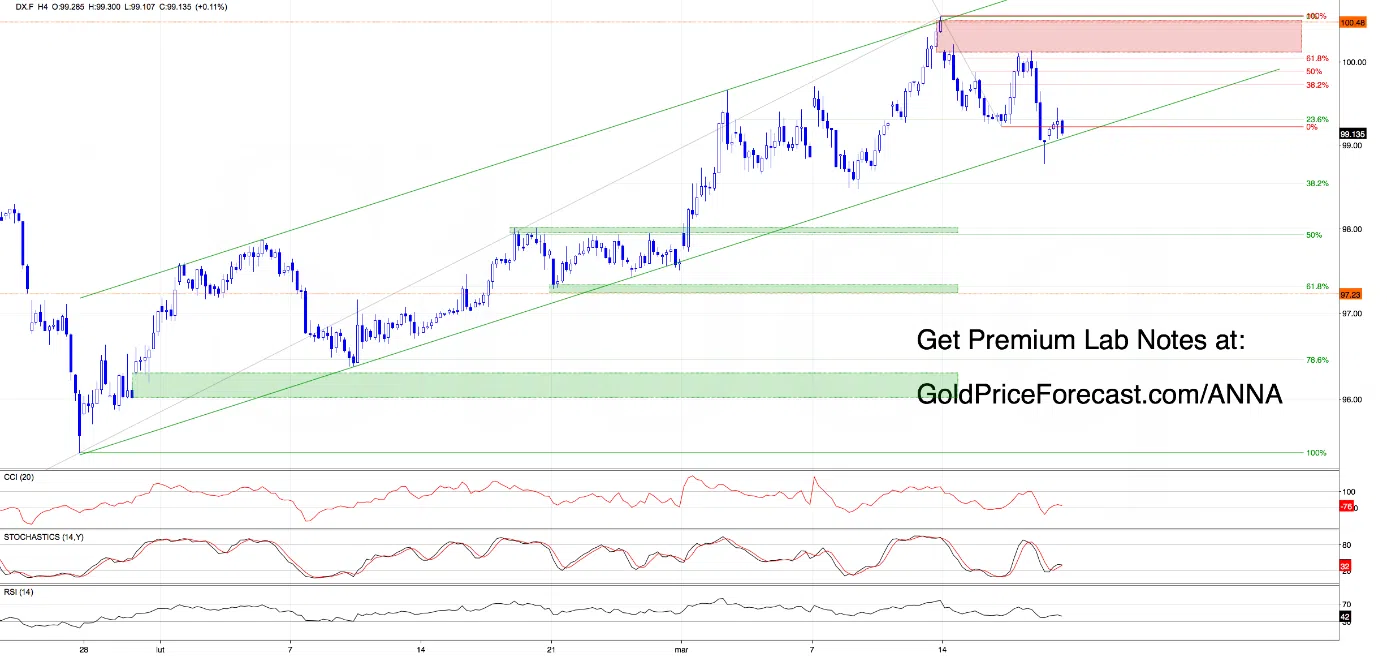
Indicators flipped bullish, price tested the lower boundary of the rising green channel, and that last candle? A bullish hammer - subtle, but important.
So, before bears take full control, we may see a very short-term corrective bounce.
If that happens, bulls will likely aim for the same battlefield again: the red bearish gap from March 16 + the psychological 100 level
And what happens there? That’s the real decision point.
Gold (GC.F): Momentum Is Strong, But Not Done Yet
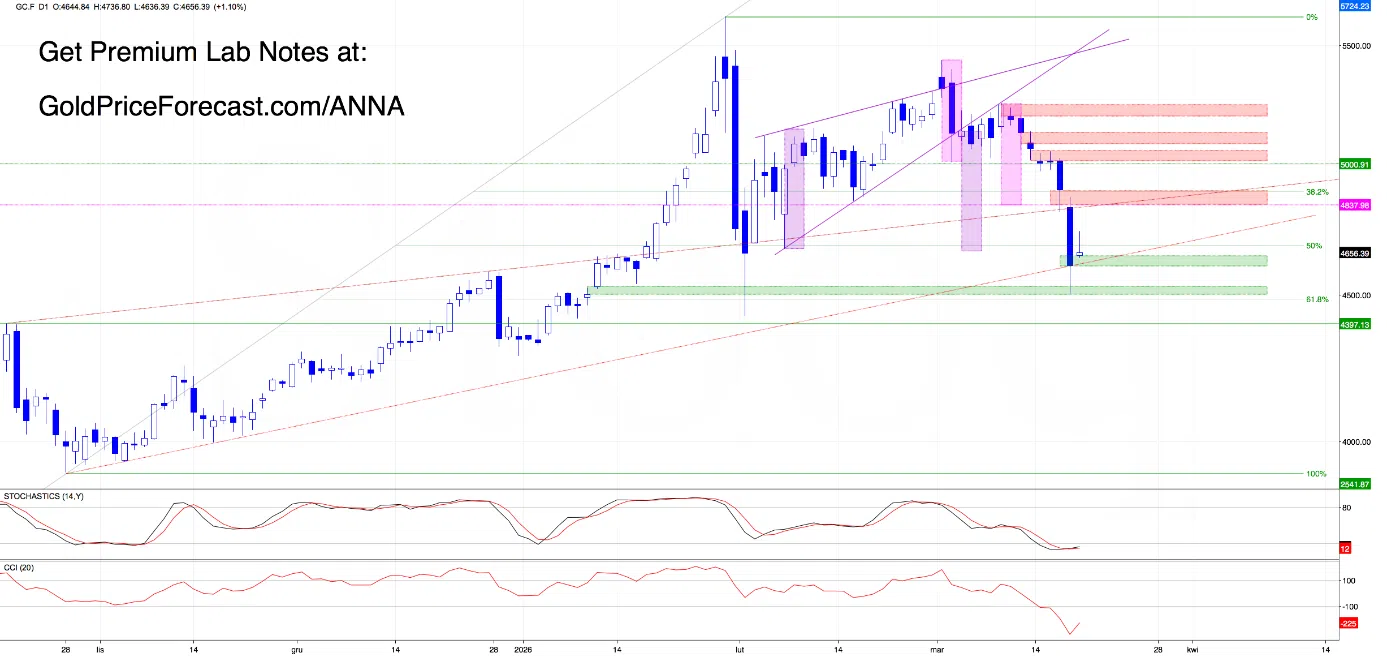
Before we dive in, let’s recall the quote from March 3rd:
“(…) Bearish Scenario
A daily close below the wedge + gap closure activates the corrective extension. If confirmed, the measured move target sits near 4665, where the size of the decline would be equal to the height of the wedge. (…)”
Looking at the charts, we see that gold did exactly what it was supposed to do. The yellow metal not only hit our downside targets (congratulations for those who trusted the bearish scenario - this was one of those moments where patience truly paid off), but pushed even further, breaking below key levels and opening another bearish gap during the Asian session (4828-4896). Let’s be honest - we haven’t seen a sequence of bearish gaps like this in a while and more importantly… bulls haven’t been able to close them.
That tells us a lot about current strength… (…)
So, where are bears could head next? → the rest of the analysis is available to Premium readers today.
Silver (SI.F): Close to Reversal… or One More Drop First?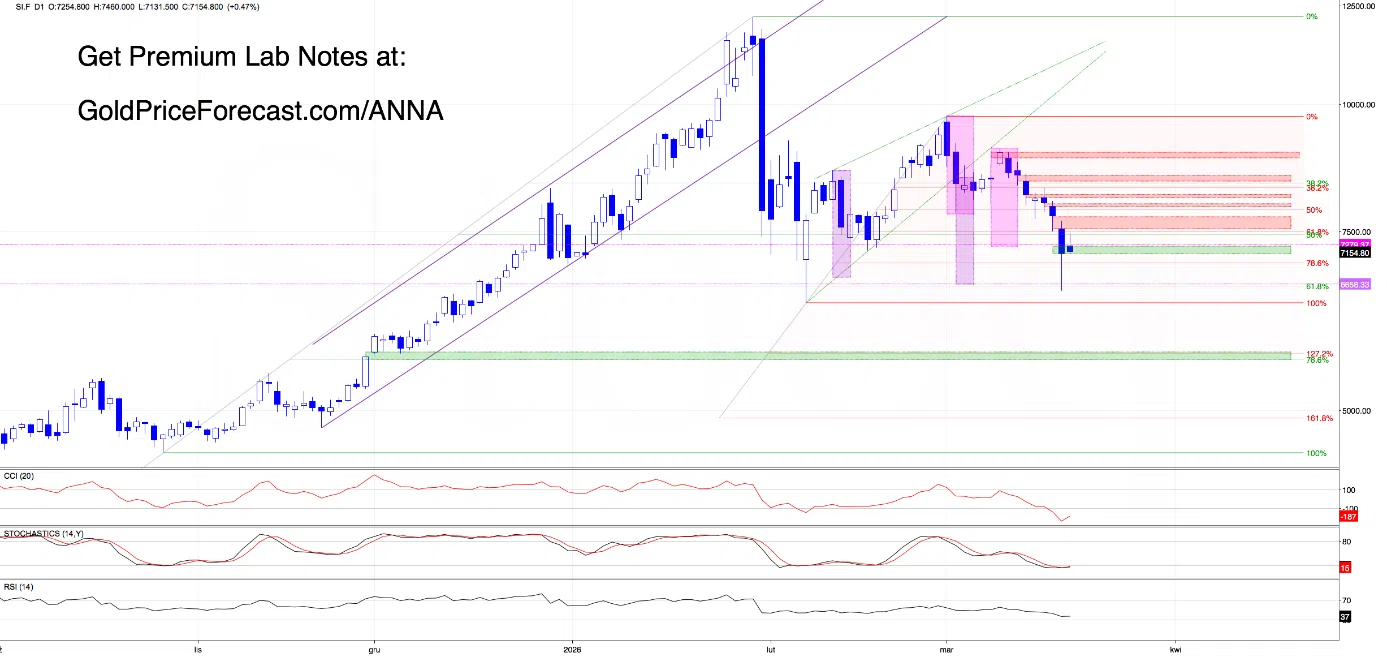
Let’s start this section with the quote from March 5:
(…) So, what’s next?
Just as in gold, (…) a daily close below the gap would significantly increase the probability of activating the bearish scenario.
In such a case silver could drop even toward 6658, where the measured move target based on the height of the wedge meets the 61.8% Fibonacci retracement of the entire rally that started on October 28. (…)”
Looking at the daily chart, we see that the above-mentioned bearish scenario played out clean, target was hit (congratulations to those who stayed patient and committed to this scenario - your discipline paid off), and price tested the 61.8% Fibonacci retracement, which naturally brings the “reversal” narrative into play.
And technically? Yes, we’re close, but context matters. → the rest of the analysis is available to Premium readers today.
Key Levels to Watch
Dollar
Resistance: barrier of 100 / 100.25-100.36 (Monday’s red gap)
Support: 99.05-99.10 (today’s small bullish gap) / 98.81-98.90 (bullish gap from March 11)
Gold
Supports: (…)
Resistances: (…)
Silver
Supports: (…)
Resistances: (…)
Today’s Takeaway
Dollar: very short-term bullish correction is likely, but the bigger picture is turning bearish. The rejection from the 100 zone and the bearish engulfing formation on the daily shift the bias to the downside. However, H4 signals and the bullish hammer at the lower boundary of the rising channel suggest a corrective bounce may come first.
The 100 area (red gap + psychological level) now becomes the key decision zone. A failure there would confirm continuation lower, while a clean break above would force a reassessment of the bearish scenario.
Gold: (…)
Silver: (…)
Final Thought: the dollar is showing early signs of a corrective bounce, while gold and silver continue to trade under clear bearish pressure. This creates a very short-term divergence and in this kind of environment, the edge comes from patience.
Let the market confirm the move at key levels before committing.
If you don’t want to miss the next move while it’s being built - not after it’s already happened - you can test Premium Lab Notes for 7 days for free here:
👉 Premium Access: Anna’s Trading Lab
Stay sharp, stay tactical and have a wonderful weekend!
Anna