After a rapid November rally, silver bulls are struggling to break through the psychological barrier of 6000.
The latest price action suggests a potential inflection point - one that may either unlock a new leg up… or signal the end of the party.
H4 Chart Insights
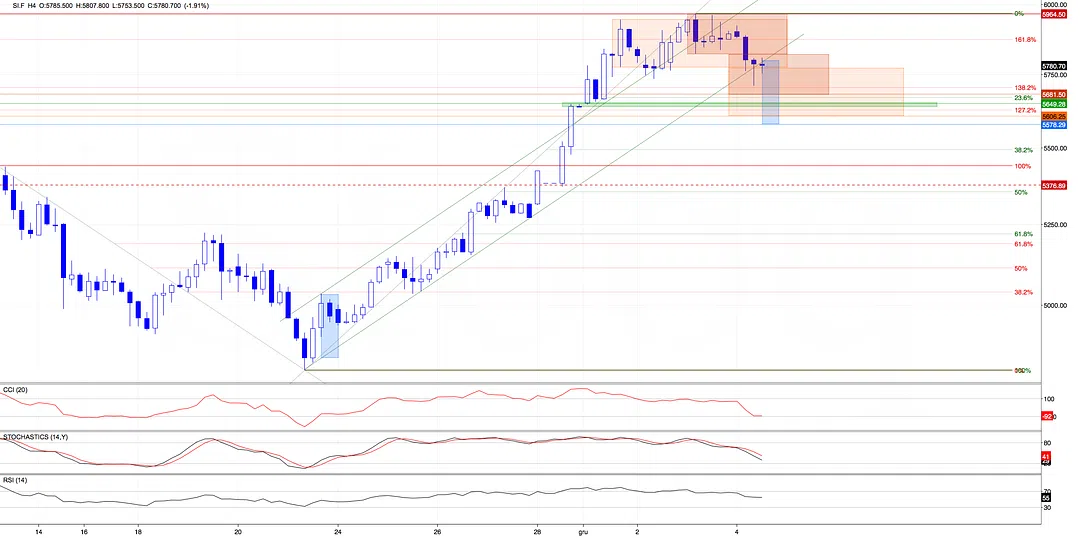
Yesterday, silver attempted another breakout above the upper border of the orange consolidation zone (discussed in detail in Lab Note #23) and tried to reclaim the 6000 barrier, but both efforts failed. That rejection not only dragged price back inside the prior range but also formed a new intraday consolidation between 5821.30 and 5964.50.
Technically, this suggests increasing indecision at the top. Psychologically, it signals hesitation and profit-taking after the strong prior move with bulls potentially losing momentum near a round-number resistance.
The mentioned failed breakout also invalidated the earlier break above the green rising channel, activating the bearish scenario from Tuesday’s Lab Note - partially fulfilled already as price retested both: the bottom of the green channel and the lower edge of the orange consolidation.
More importantly, sellers drove silver below yesterday’s consolidation, suggesting that unless bulls reclaim the lower channel border and invalidate this breakdown, we may see continuation to the downside.
Downside Targets (Bearish Path):
- 5670-5678 -> the 23.6% Fibonacci retracement of the Nov. 21-Dec. 3 rally + measured move from yesterday’s range
- 5640-5650 -> small bullish gap from Monday
- 5600-5605 -> measured move from Monday’s broader consolidation + psychological support
Daily Chart Insights
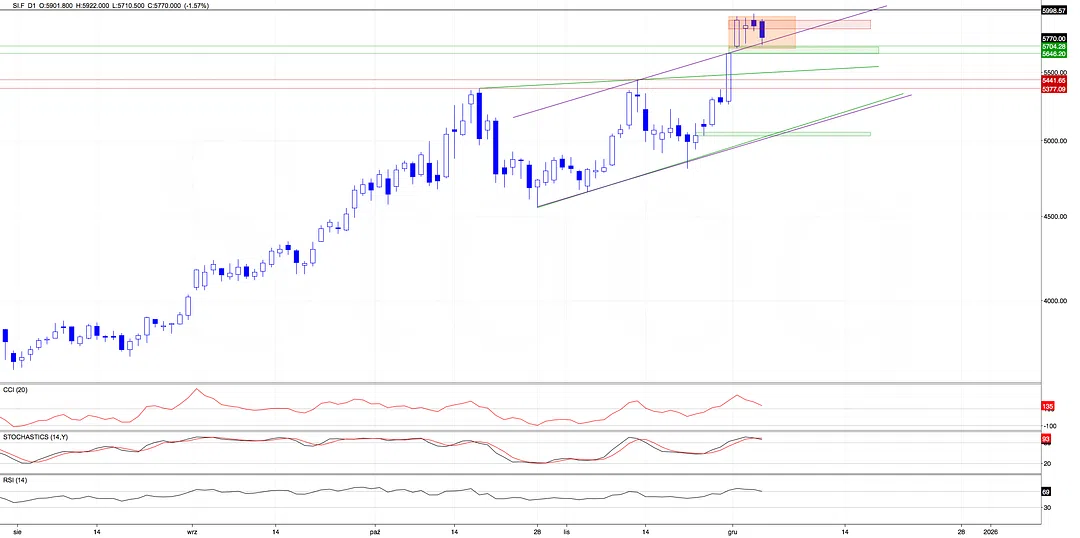
But bulls may still have an ace up their sleeve… today’s drop brought silver into a critical support zone: the previously broken upper border of the violet rising channel and Monday’s green gap area.
What does it mean?
As long as bears fail to close the day below this cluster, bulls are still in the game – especially when we take into account the fact that the current pullback is shallow (not even reaching the 23.6% Fibonacci retracement), which means that the short-term structure remains mostly intact.
Additionally, the two price gaps on the daily chart also define a clear consolidation box and only a daily close outside of it will likely unlock a bigger directional move.
And one more thing…
Today’s USD Index close may be a critical driver… if the U.S. dollar bulls fail to neutralize the island reversal pattern (discussed in Lab Note #25) silver bulls may catch a fresh tailwind. However, if the greenback pushes higher and closes above Monday’s low, we could see renewed pressure on silver’s key support.
My takeaway for today: please watch the daily close like a hawk. That’s your signal. If silver stays above the violet channel + Monday’s gap -> bulls still hold the cards. But if price breaks and closes below 5645-5700, the downside path may open up, potentially attracting more bears back to the stage, which could raise the risk of a deeper move toward the 5500 region. And don’t forget the USD Index: its move today may tilt the board.
Key Levels to Watch:
- Resistances: 5964.50, 6000
- Supports: 5670, 5640-5650, 5600
- Line in the sand: lower edge of the daily gap + upper line of the violet channel
Another dot connected. Another trail unfolding. See you on the next chart.
P.S. Please keep in mind that this week only, you can unlock full Premium access for just $9 (instead of $99) - no strings attached. Because the real magic is just getting started: U.S. indices, FX setups, oil, and the deeper mechanics.
Click here to unlock Premium for just $9 and I’ll see you inside the Lab.
Anna
Trading Lab Founder