As this volatile week draws to a close, all eyes are on the US Dollar Index.
After a brutal selloff and a few signs of life from the bulls, we’re now at a technical crossroads. This next move could determine not only how we end the week, but how we kick off next Monday’s session.
H1 Chart: Bulls Back from the Dead?
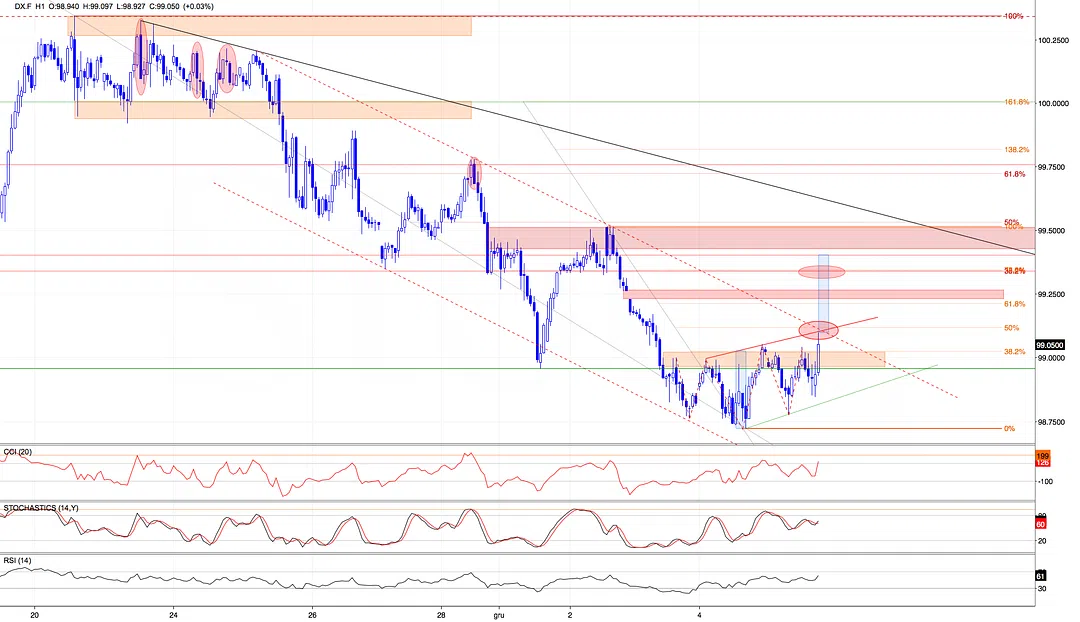
After printing a fresh local low, dollar bulls came roaring back, closing Thursday's session not only above Monday’s low, but also erasing a textbook island reversal pattern we flagged in yesterday’s Lab Note. That alone is a major short-term win for the bull camp.
The rally took the index straight into the 38.2% Fib retracement of the recent leg down and a cluster of past very short-term tops. No surprise, sellers tried to fade the move again. But here's the twist…
Despite two failed attempts, the bulls refused to back down. On the third try, they managed to break above the orange area and are now pushing right into a major resistance zone (created by the upper border of the declining red channel, the 50% Fibonacci retracement, the red neckline-like resistance [based on previous swing highs]).
Additionally, as you can see, a potential inverse head and shoulders pattern is forming.
This combo makes it a textbook moment of truth - a zone that could make or break the very short-term trend.
What Could Happen If Bulls Win This Fight?
A successful breakout here could lead to:
- A quick upward move into the red gap zone at 99.23-99.26
- If closed, that opens the door to the next resistance area: a combination of two major Fibonacci retracements (38.2% of the full downward move from November peak + 78.6% of this week's swing)
- Breaking that would confirm the inverse head and shoulders pattern and bring 99.40 into play (or even a retest of Monday's highs and 50% of the entire move down)
What If the Bulls Fail?
Then we watch for:
- A retest of the green line based on the last local lows
- If that breaks, we’re likely heading straight back to the recent low
And don’t forget - this is Friday and the weekly close is at stake.
D1 Chart: Weekly Close = Weekly Signal
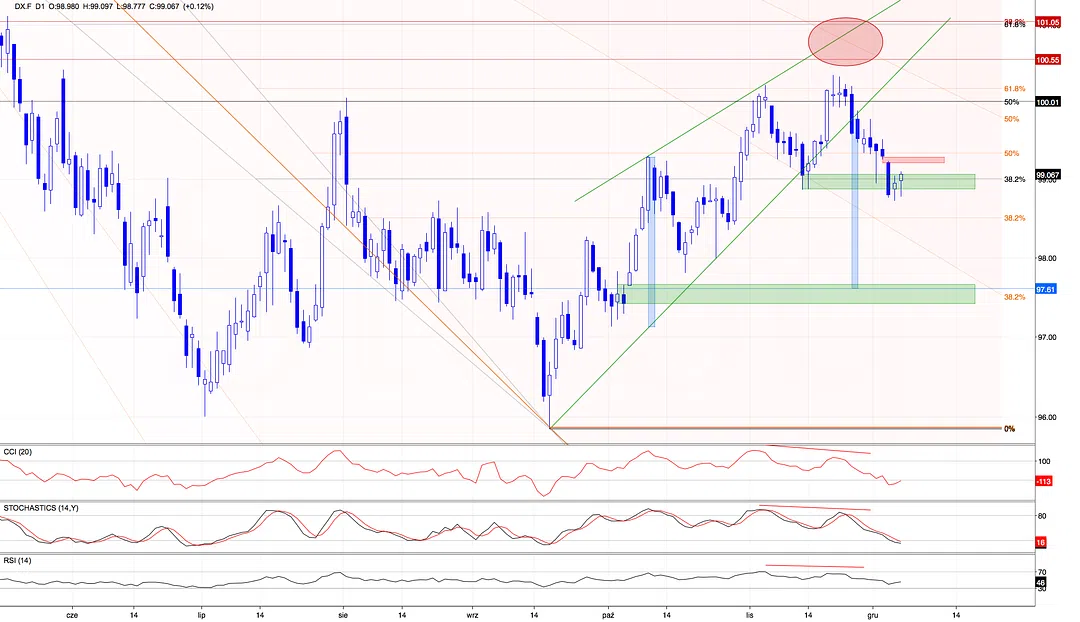
Why is this close so important?
Because if bulls can't defend here and we head into next week under pressure, we could see a test of the 38.2% Fibonacci retracement of the entire uptrend from mid-September to November 20th, sitting around 98.60.
My takeaway: we’re at a combination of pattern completion, Fibonacci levels, and channel dynamics. Therefore, it’s so important which side takes control here because it will likely dictate the tone early next week. Don’t ignore how we close this daily candle.
Another dot connected. Another trail unfolding. See you on the next chart.
P.S. Please keep in mind that this week only, you can unlock full Premium access for just $9 (instead of $99) - no strings attached. Because the real magic is just getting started: U.S. indices, FX setups, oil, and the deeper mechanics.
Click here to unlock Premium for just $9 and I’ll see you inside the Lab.
Anna
Trading Lab Founder