Today’s charts prove that silver can steal the spotlight. Let’s take a closer look and see who’s really in control.
Daily Scan
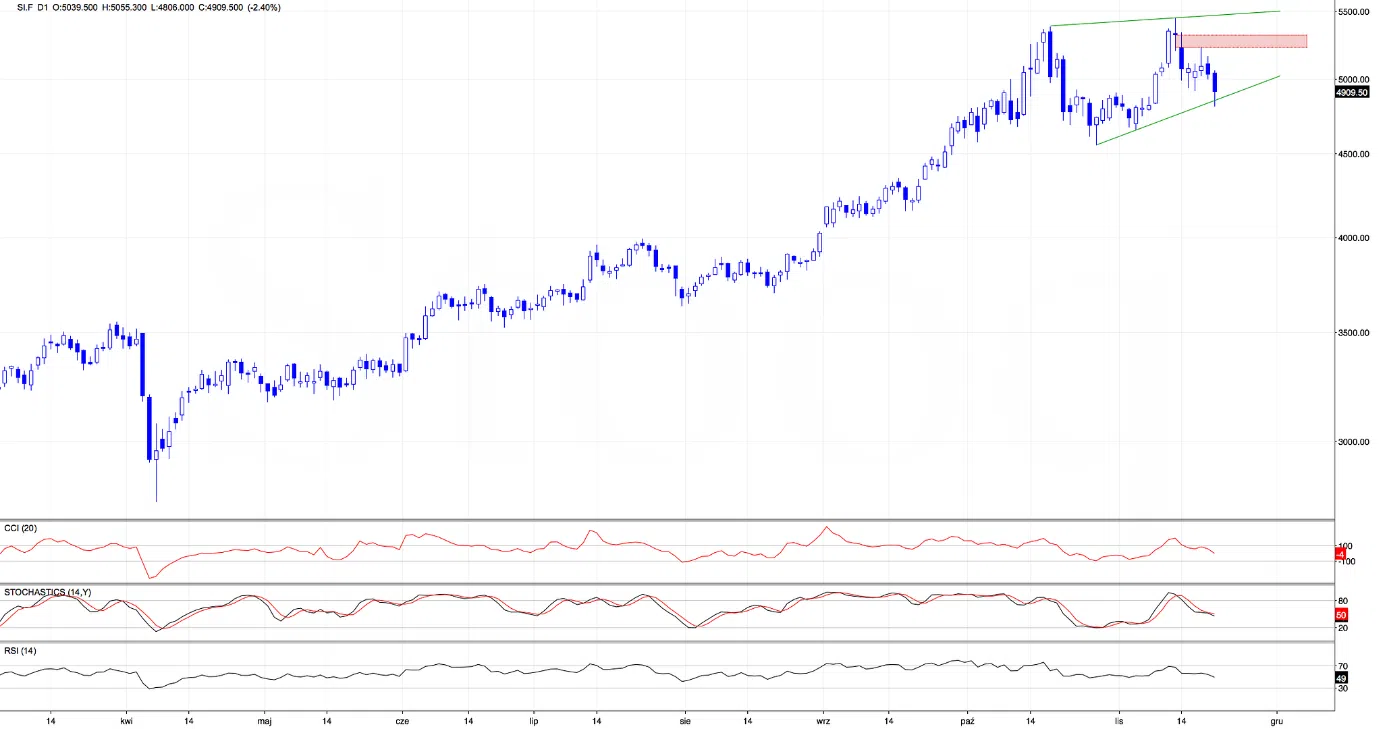
Let’s start with the obvious: the breakout above the previous high was invalidated. What followed? A textbook red gap the very next day – two back-to-back bearish signals in a row.
On Wednesday, bulls failed to close the gap – a clear sign of weakness – which led to a test of the key 5000 level yesterday. And today? We’re trading below it, which is giving the bears another point on the board.
Indicators? All three are flashing sell signals, firmly aligning with the bearish narrative.
So… do buyers have anything left in their defense?
Only one card: the green support line (based on the previous lows), which is also the lower boundary of the rising wedge. And that’s where the story turns.
Why?
The next big move will likely hinge on whether this line holds or breaks.
Although the daily picture is starting to tilt in favor of the bears you already know this lab a bit and you know we don’t stop at surface-level signals.
Let’s zoom in to the H4 timeframe, where things get even more interesting.
If you’ve been following the Lab closely, you might remember the Fibonacci fan we highlighted in yesterday’s Lab Note #4 on gold. Turns out it wasn’t just gold listening.
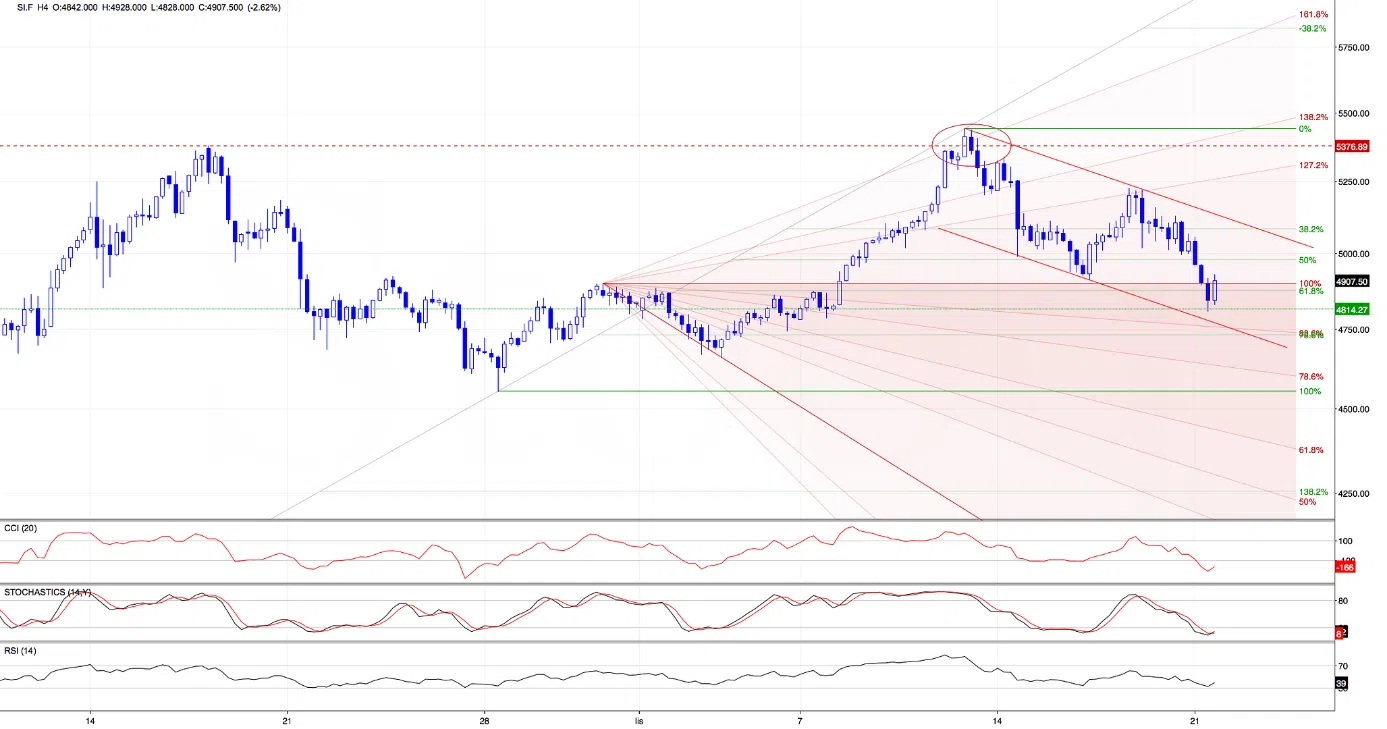
On the above chart, we can see that the 161.8% extension of the fan worked like clockwork – acting as a turning point that decisively stopped the bullish momentum. The reaction? Sharp and clear, which triggered a rejection that sent price back down toward the origin of the fan.
On Nov. price revisited the launch point of the fan… but once again momentum stalled. The red gap we discussed on the daily chart proved too much – buyers couldn’t close it and that weakness flipped the script.
What followed was a clean reversal with silver diving into a descending red channel and breaking below the 61.8% Fibonacci retracement. However…
As price approached the lower border of that channel – and even more importantly, the bottom support line of the wedge pattern we saw on the daily chart – bulls finally showed signs of life.
Now, with indicators turning and a reaction off key confluence support, we’re watching closely. If buyers can reclaim the Nov.18 low and close the day above it – this could mark the beginning of another bullish swing.
In short?
The setup is here. The key level is defined. And momentum could shift fast.
The previous charts gave us the key structures, but if we really want to catch the current pulse of the price, we need to step into the H1 timeframe.
Let’s drop in.
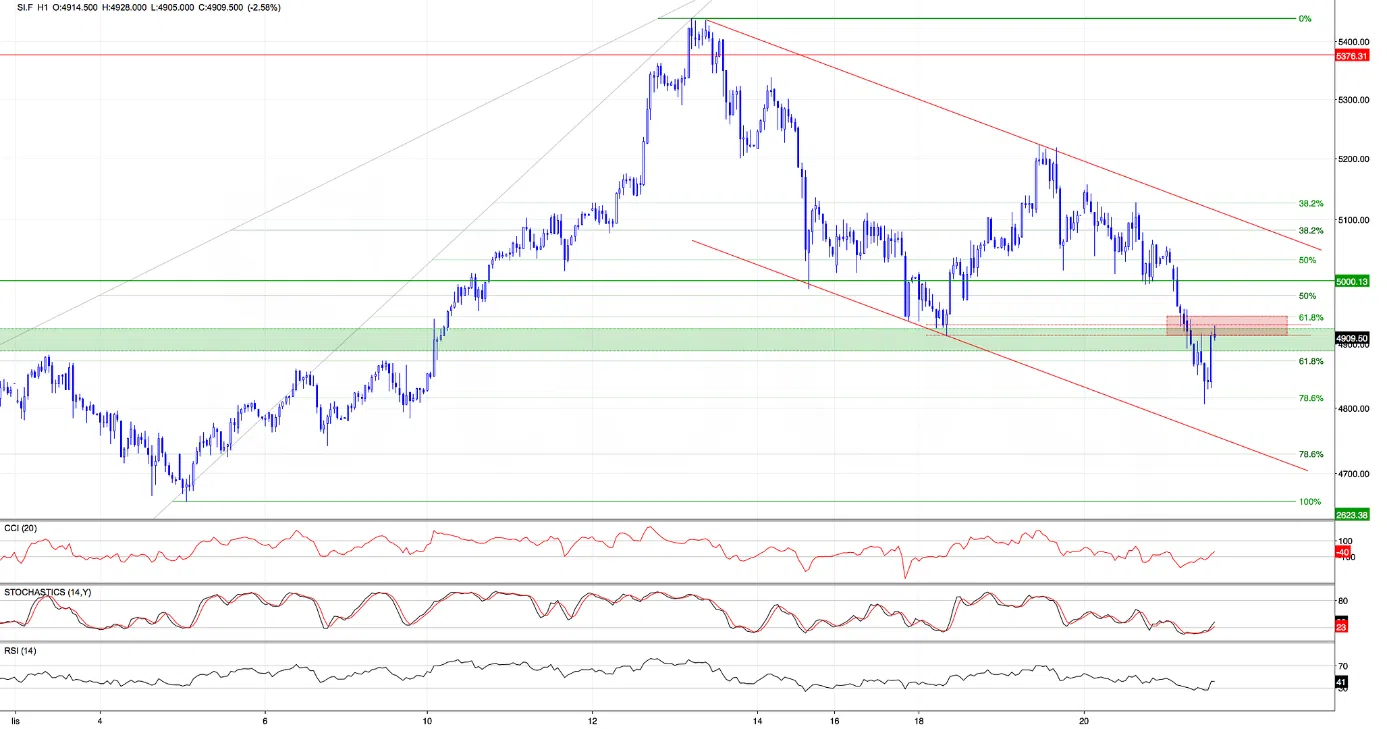
The hourly chart zooms us into today’s key move - a textbook bounce right at the 78.6% Fibonacci retracement (based on the entire Nov. move). Combine this with the bottom of the wedge (highlighted earlier on the daily chart) and? The bulls had reasons to show up.
Price snapped back to a very short-term resistance zone created by the Nov.18 low and the previously broken 61.8% Fibonacci retracement of the entire Nov. rally.
This is now the battlefield.
What’s even more interesting is that all three indicators (CCI, Stochastics and RSI) just printed fresh buy signals. Therefore, if the bulls manage to close today’s session above the Nov.18 low (and even better above the 5000 barrier) momentum could shift in their favor.
Technical Summary
Daily chart:
- Failed breakout above the previous peak + follow-up red gap = 2 strong bearish signals.
- Bulls failed to fill the red gap -> sign of weakness
- Price broke below the 5000 level
- Now testing the lower border of the green rising wedge = the last chance for bulls
H4 chart:
- Fibonacci fan also worked perfectly here
- The 161.8% level nailed the local top
- Bulls failed to close the red daily gap -> price reversed
- Price is moving inside the red declining channel, but mentioned wedge + indicators’ support hit a potential bounce
H1 chart:
- Today’s selloff found exact support at the 78.6% retracement
- Price rebounded and retested the key resistance zone (61.8% + Nov.18 low)
- Fresh buy signals from all three indicators
- If bulls break above this zone, a very short-term upside move could follow quickly
What to watch today?
- Wedge support -> a breakdown would tilt the bias toward the bears
- Resistance zone near 4910-4945 – a confirmed breakout here could fuel more upside
Summing up, today’s silver’s story is not only about candles and zones – it’s about persistence. A failed breakout, a brutal reversal and now… a spark of fight from the bulls right where it matters most. Please keep your eyes on that wedge line because the next move could write the next chapter.
Anna
P.S. The premium analyses will be available to you for a full week, but after that this space will only include limited, free analyses. To ensure premium access sign up to my premium Trading Lab today.