Silver’s bounce looks real… unless it isn’t. The next move hinges on 5000.
Market Context:
After a sharp bounce from the lower border of the green wedge and the 78.6% Fibonacci level (highlighted in our previous Lab Note), silver is now consolidating around the key 5000 level. This may be the ignition point for the next bullish wave - or just a pause before a pullback.
I’m watching for confirmation.
Daily Chart: A Signal Ignited?
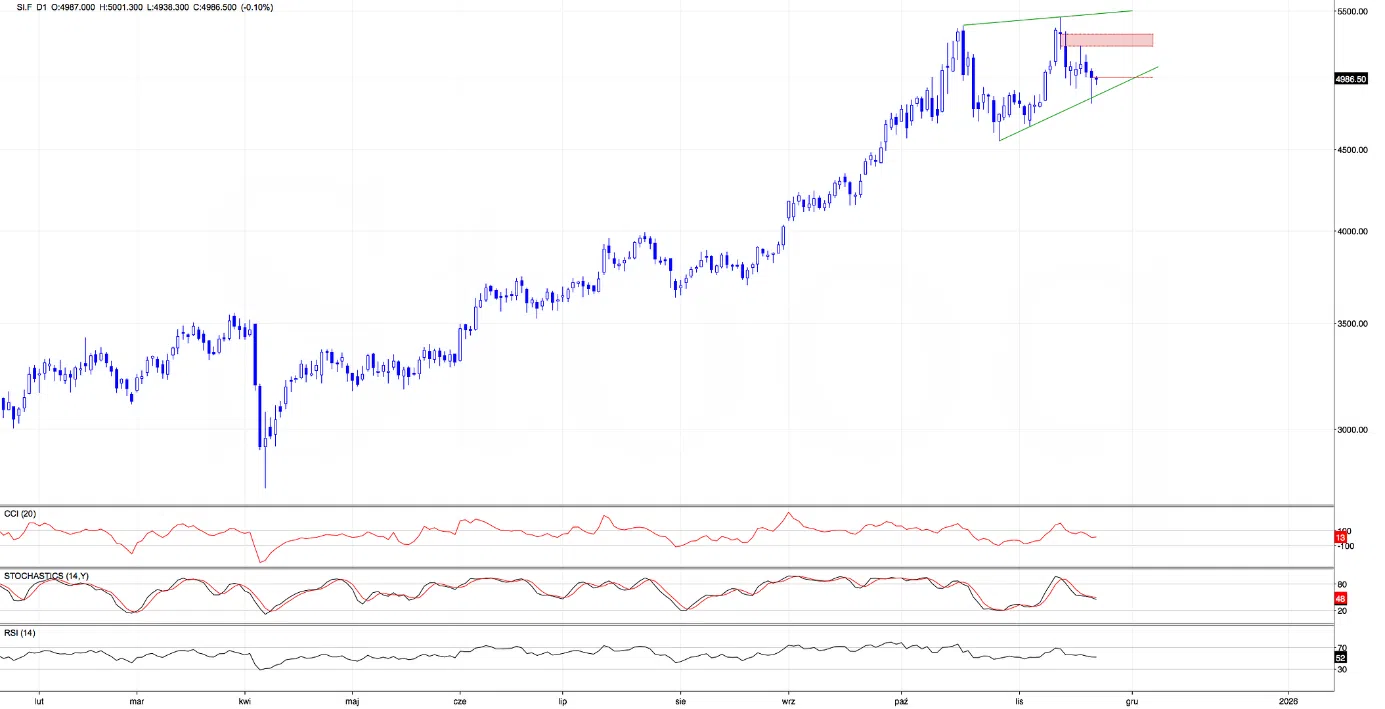
Friday’s candle gave us something to think about - a clean bounce off the lower wedge boundary, with the daily chart printing a textbook hammer.
For those new to candlestick psychology: hammers at support are a classic reversal signal.
They suggest that buyers stepped in decisively after an intraday sell-off - and they weren’t shy about it. But… not everything was perfect. Bulls failed to reclaim 5000 on the close - a psychological level still acting as resistance. Additionally, this week started with a small red gap.
What does a bearish gap mean?
- Traders come into Monday with hesitation, not confidence.
- There’s not enough buying pressure on the open to lift the price above Friday’s close.
- It often reflects either weekend uncertainty or residual bearish sentiment from Friday’s session.
What could happen next?
The market is already whispering: “Not so fast, bulls.” Now, the way the price behaves in the next few hours will tell us everything.
Let’s explore the possible paths from here:
- In the first version, bulls show up quickly. Price fills the gap, climbs back above Friday’s close and reclaims the key 5000 level. If that happens, the bearish gap becomes nothing more than a bluff. In other words, bears had their chance, but they didn’t take it. That kind of recovery often fuels continuation, with 5115, 5165, or even 5190 back on the radar.
- In the second version, the gap stays open… and price drops even lower. That would cast serious doubt on Friday’s bounce. If this path unfolds, the wedge lower line could come back into play, and with it, a revisit to 4870 or even lower.
So, let’s zoom in…
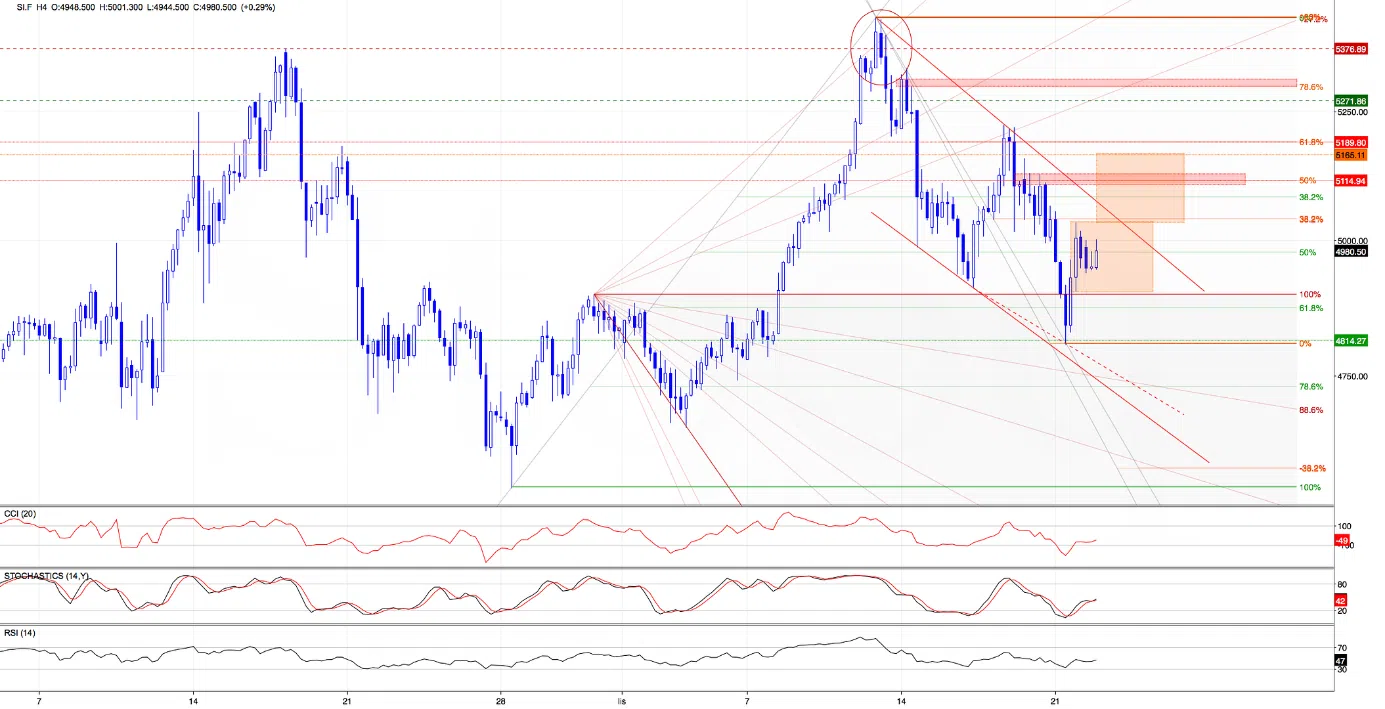
H4 reveals the chessboard where bulls and bears are now squaring off.
From this perspective, we see that silver moved higher, climbing almost precisely to the 38.2% retracement of the last down leg. But instead of slicing through it, the price began to stall. A sideways move started forming around the 5000 barrier - a psychologically and technically important level (I marked this zone with orange).
What about indicators? They’ve already fired buy signals. That’s a green light for bulls, but only if the price can break above the very short-term red declining trendline based on the previous highs.
If they do this, the roadmap becomes clearer:
- The first target: 5115, right at the 50% retracement.
- The next targets: 5165 (in this area, the size of the upward move would correspond to the height of the orange consolidation) or even 5190 (a combination of the 61.8% Fibonacci retracement and the last week’s highs).
The momentum is building… now let’s narrow the focus to see how bulls are playing on the hourly chart.
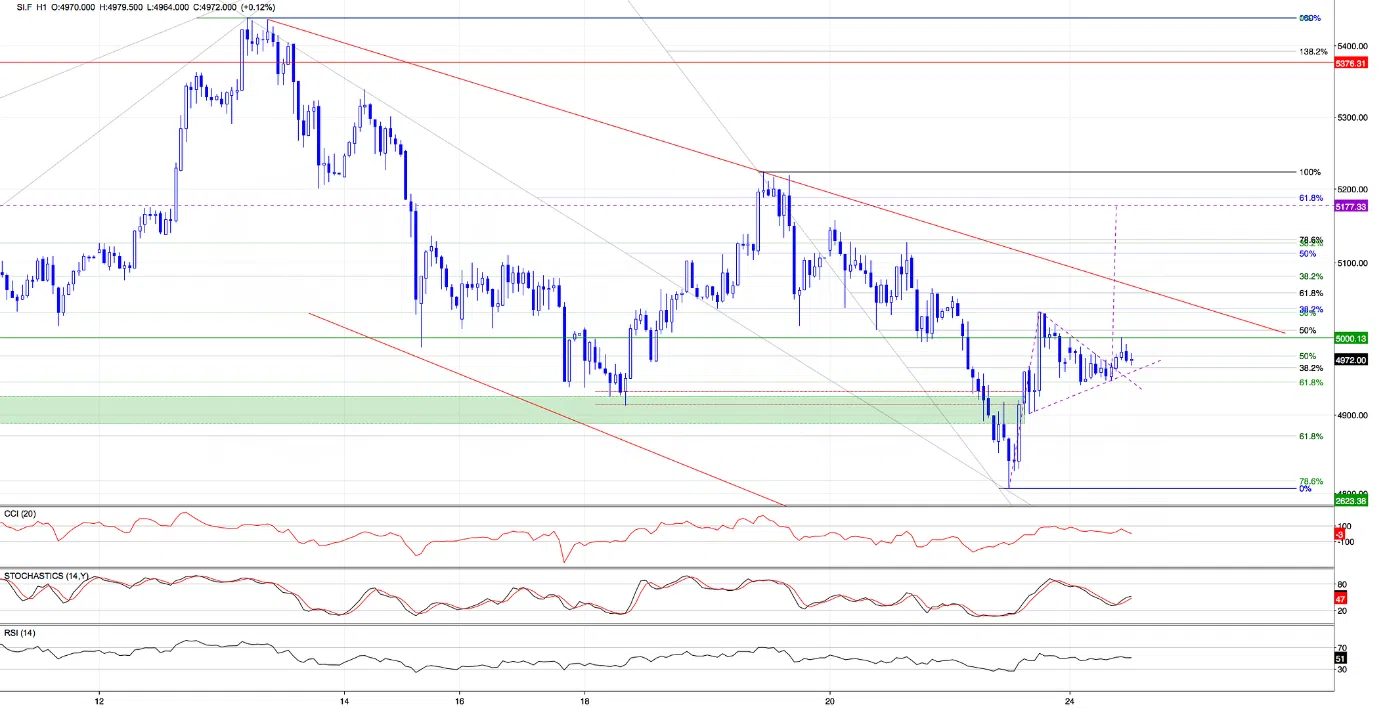
The one-hour chart adds even more intrigue. We’ve got a bullish pennant pattern - a classic continuation setup, and it’s already broken to the upside. Textbook. Formations like these typically resolve in the direction of the prior trend - and the measured move gives us a target near 5175.
Will the bulls make their move this week?
In my opinion, the odds will increase significantly if they manage to break above the orange consolidation zone (marked on the 4-hour chart) and close the red gap (marked on the daily chart). That would clear the way for a real test: the upper boundary of the red descending channel.
The battle at that level will decide their fate: a confirmed breakout would signal that the bulls have regained strength and are ready to aim for the targets we discussed earlier. However, if they fail here, we should be prepared for a move back below the 5000 level… or even a re-test of the lower boundary of the green rising wedge.
That’s what caught my eye before the bell. Curious to see how it plays out?
So am I.
Let’s track it together.
Anna
P.S. The premium analyses will be available to you for a full week, but after that, this space will only include limited, free analyses. To ensure premium access sign up to my premium Trading Lab today.