Gold kicked off the new week with renewed energy, but will it be enough to turn momentum into a breakout?
In this Lab Note, I break down the daily, H4, and H1 charts to see if the bulls have what it takes… or if another trap is waiting just around the corner.
Let’s start with the daily chart.
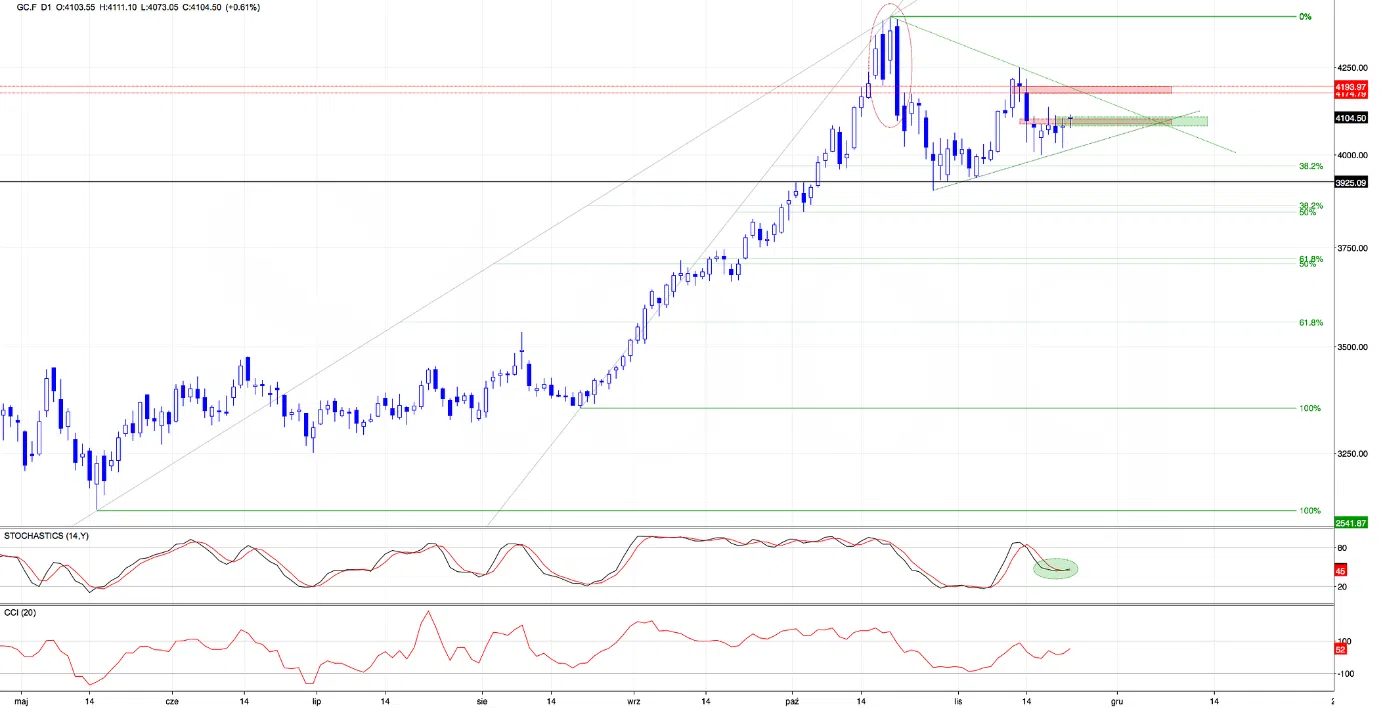
The new trading week opened above an important level of 4100, and that alone has already shifted the landscape. This price action not only began to close the bearish gap from last Monday, but it also created a fresh bullish green gap that now acts as important intraday support.
Additionally, the Stochastic Oscillator flipped, generating a new buy signal, giving bulls a much-needed push for confidence.
So, are these good signs for the bulls? Absolutely. But to truly matter, this momentum needs confirmation. A strong daily close above 4100 would turn these encouraging signals into a credible breakout narrative.
Having said that, let’s take that momentum down to the H4 chart.
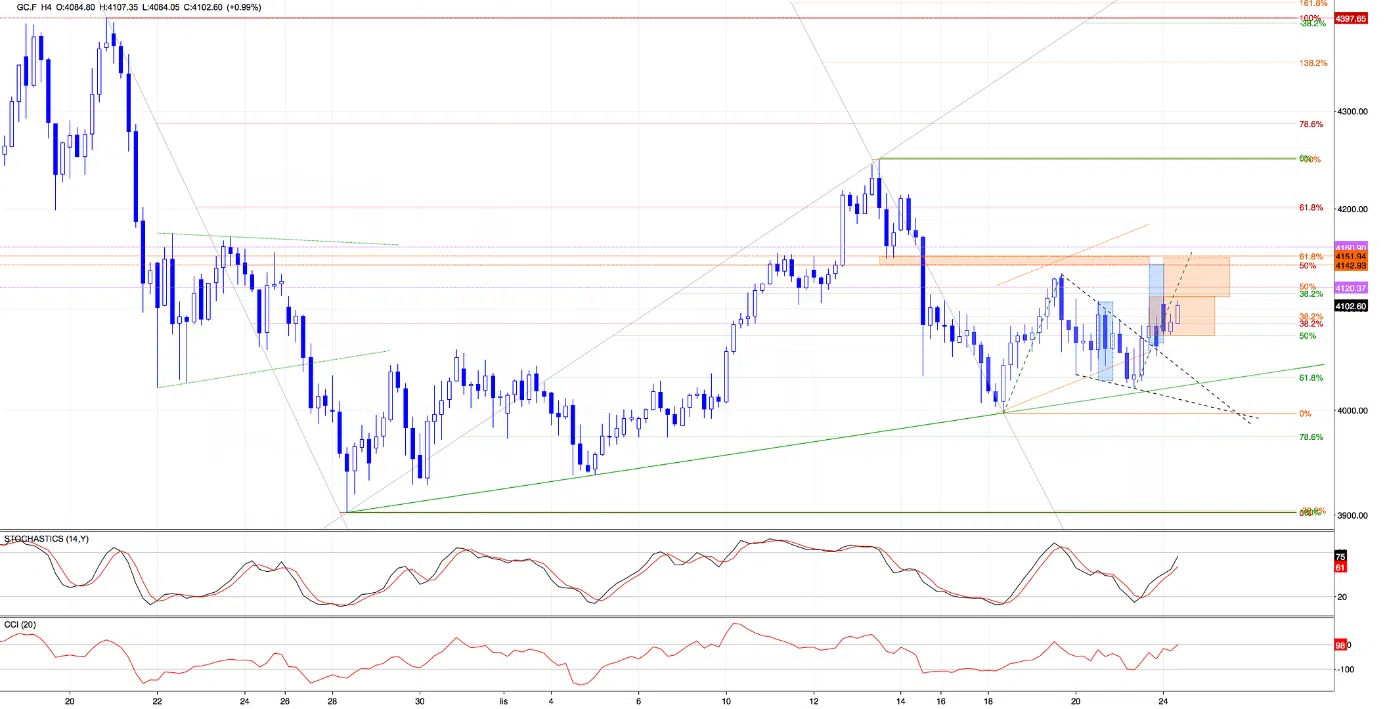
The first thing that catches the eye here is the bullish breakout from the declining wedge pattern - a classic signal that selling pressure is weakening and a potential trend reversal is underway. Typically, breakouts from such formations are followed by continued upward momentum - especially when confirmed by strong volume or additional signals.
Currently gold is still wavering within the orange consolidation range. This kind of sideways action suggests temporary indecision or balance between buyers and sellers. However, when we consider the still-active buy signals on this timeframe (and the bullish signs from the daily chart) the probability of a breakout to the upside increases meaningfully.
If the market follows through, we could see a push toward the next significant resistance zone around 4143–4152.
That target area is important for three reasons:
- It aligns with the measured move of the declining wedge
- It hosts a combination of 2 very important Fibonacci levels (50% and 61.8%)
- It coincides with the local swing lows from Nov. 13, 2025
Zooming in further, the H1 chart adds another interesting layer.
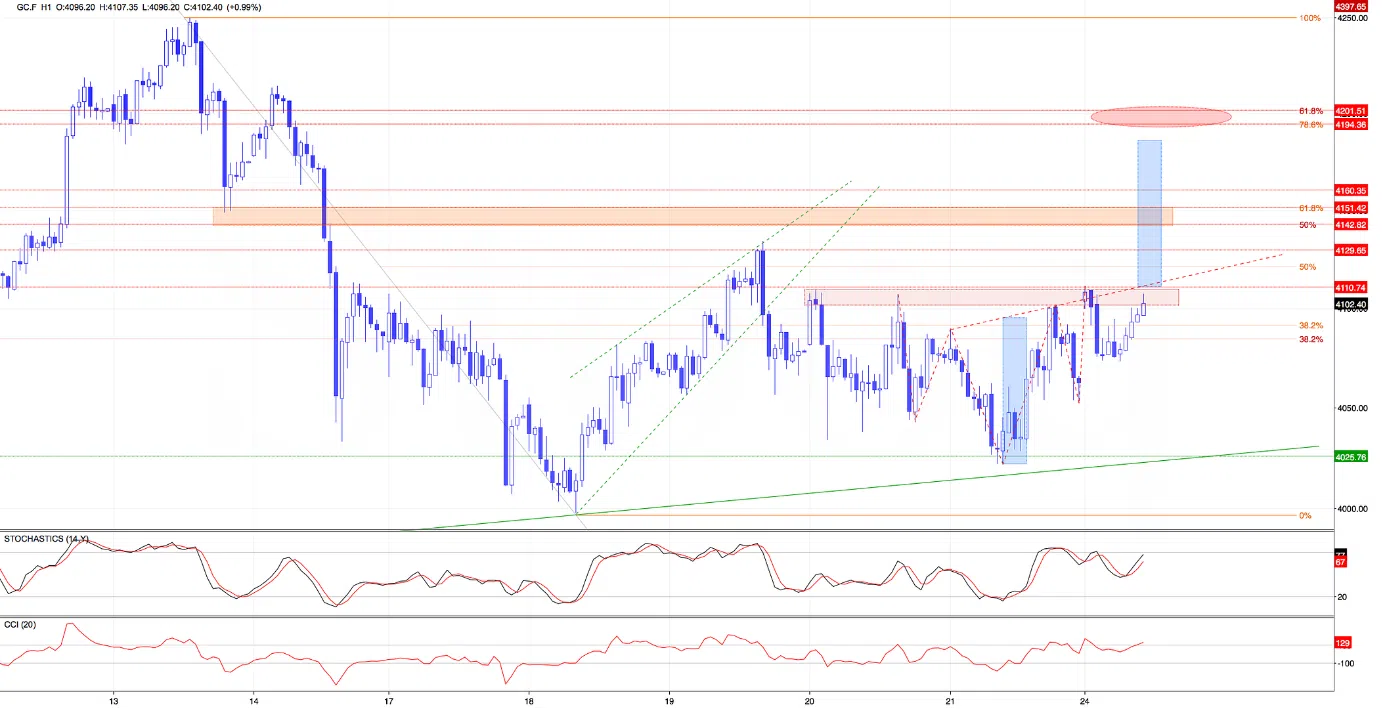
From this perspective, we’re seeing the early structure of an inverse head and shoulders pattern… a well-known reversal setup suggesting that sellers may be running out of steam.
Why does this matter?
Because once price successfully breaks the neckline and breaches the nearby red resistance zone, it can act like a green light for the bulls, triggering buying.
If that breakout happens, the first target could be not only the 4143–4152 zone, but the pattern's measured move would suggest potential for an extended rally - possibly all the way to the 4188 or even to the next resistance zone around 4200 (marked with red ellipse).
Connecting the dots… gold is showing bullish intentions across all three timeframes: the daily chart holds a fresh support gap and a buy signal, the H4 chart just broke out of a declining wedge and the H1 chart is teasing a textbook reversal setup. But the key battleground lies just ahead: if the bulls manage to break through 4100 and the neckline of the H1 formation then a strong move toward 4143+ or even 4188 may be within reach. However, failure to hold above 4100 could cost buyers lose their edge and we may return to consolidation or corrective action (even a re-test of the upper line of the declining wedge).
Keep an eye on those key levels - the next few candles may decide whether this is just a Monday bounce… or the beginning of a serious bullish comeback.
Anna
P.S. The premium analyses will be available to you for a full week, but after that, this space will only include limited, free analyses. To ensure premium access sign up to my premium Trading Lab today.