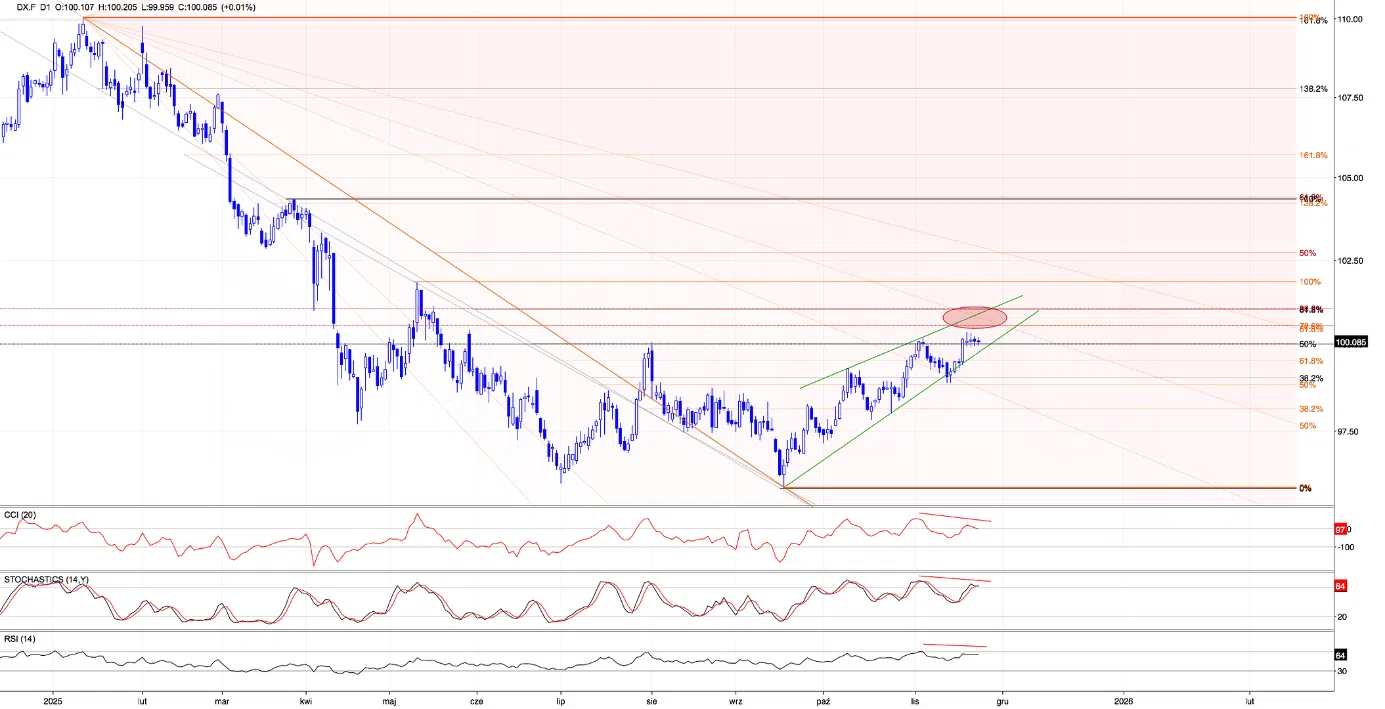
The USD Index remains inside a narrow rising wedge that has been developing since mid-September.
This pattern, combined with weakening momentum and mixed follow-through, places the U.S. dollar in an environment where direction is highly sensitive to breakout success or failure. The psychological level of 100 continues to act as a key pivot.
Technical Point of View
1. Pattern
The index continues to move inside a rising wedge – a structure typically associated with trend exhaustion or late-cycle slowing.
2. Break above 100 & previous highs
The breakout above the psychologically important level of 100 and above the previous highs would normally confirm bullish continuation. However, a lack of strong follow-through could signal hesitation from buyers, potential traps for breakout participants and weakening conviction at higher levels.
3. Candle structure
Recent sessions printed candles with small bodies and prolonged upper shadows (a classic sign of indecision), suggesting a stalling momentum and increasing probability of a failed breakout scenario.
4. Indicators
The CCI, the Stochastic Oscillator, and the RSI all show clear bearish divergences. Multi-indicator and multi-day divergences inside a wedge environment significantly increase the odds of trend fatigue or even a deeper corrective move.
My Takeaway
The daily chart shows a trend continuation attempt with weakening internal strength, forming a classic late-stage pattern: breakout + indecision candles + divergences + rising wedge apex.
In my opinion, this puts the USD index into a high-risk zone where both continuation and reversal scenarios are open, but bulls must defend quickly, or momentum will collapse.
From this perspective, we see that the breakout above the previous November high has been invalidated and the price slipped back below it. In technical terms, it means that the breakout buyers are now trapped, bullish momentum failed to sustain and… market structure turned into consolidation mode.
The upper border of this formation – November peaks, the lower border – a psychologically and technically important level of 100. This forms a quite tight range, which suggests that only a breakout or a breakdown will give us more clues.
- Bullish Scenario
Breakout above the range suggests a climb to the 78.6% Fibonacci retracement (based on May - September drop) around 100.55 or even to the upper border of the higher-timeframe resistance zone marked on the daily chart created by the 38.2% retracement (based on the entire 2025 decline), the 61.8% retracement of March - September downward move and the upper border of the green rising wedge (around 100.90-101.05).
In my opinion, this zone is dense, high-confidence resistance and is likely to produce either a rejection or at least a corrective reaction.
- Bearish Scenario
A break below the consolidation floor will likely open the way to 99.55 - 99.60 (where the size of the downward move would correspond to the height of the formation and where the 50% retracement of the mid-November rally is) or even to the lower border of the green rising wedge from the daily chart (major trend support).
In my opinion, a break below the wedge support would mark a short-term trend change.
Summing up, the USD index is stuck in a tight consolidation slightly above 100.00, and the combination of a rising wedge on the daily chart plus strong momentum divergences signals fading bullish strength. The failed breakout above the previous November high adds downside pressure and increases the risk of a deeper pullback. However, as long as the barrier of 100.00 holds, the market stays in consolidation mode and only a decisive break below it could flip the very short-term outlook.
Another dot connected. Another trail unfolding. See you on the next chart.
Anna
P.S. The premium analyses will be available to you for a full week, but after that, this space will only include limited, free analyses. To ensure premium access sign up to my premium Trading Lab today.