


Welcome to the Labor Day Special Report.
As you know, we’re not posting regular Gold Trading Alerts when the U.S. markets are closed – for instance today they are closed for the U.S. Labor Day. And yet, the tendency for gold to do the same thing over and over again right or soon after the Labor Day is so strong that I couldn’t help it but describe it to you today.
===
US markets are closed today, so there is no tape to read (except the fact that gold and silver futures are down by about 0.6%-0.7%). There is a calendar to read instead, and gold has had a habit around this date that is worth a closer look, because the year it most resembles is the one where that habit mattered most.
The Record Since 2011
The dashed lines on the chart below mark each Labor Day since 2011. In most years, gold was lower within weeks of the line.
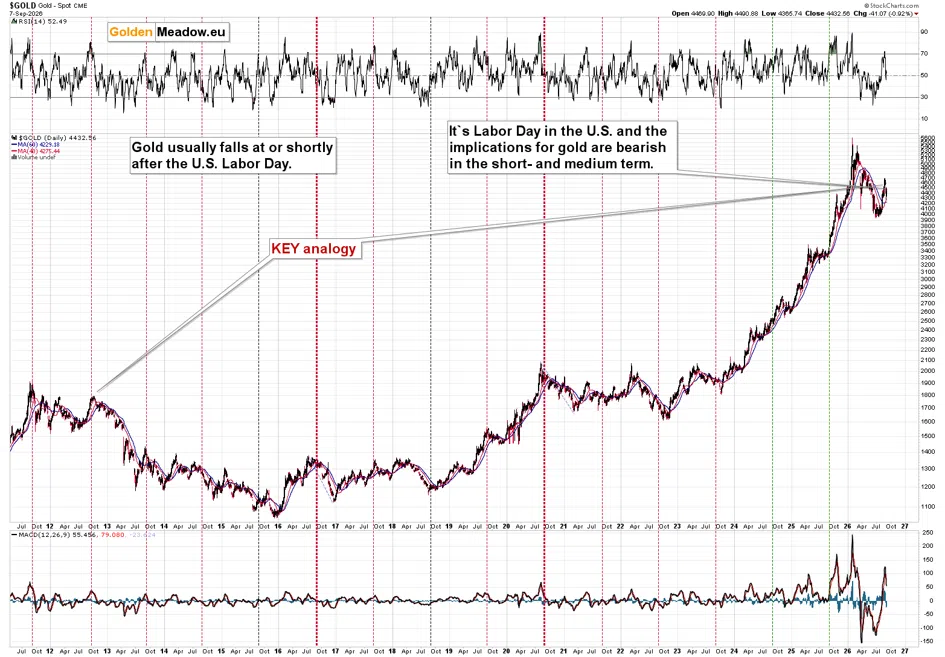
The full record, year by year:
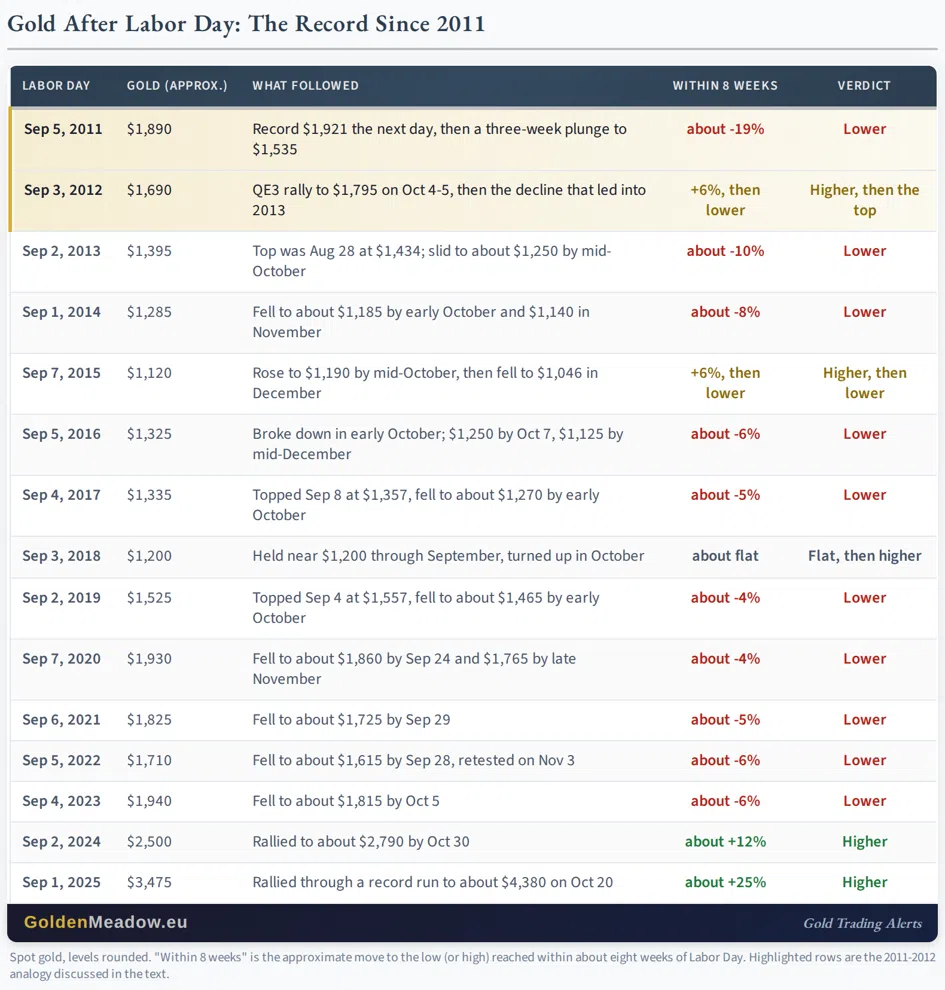
Ten of fifteen years saw gold lower within about eight weeks, by 4 to 19 percent. Two more (2012 and 2015) rose for a month and then fell, and one (2018) went nowhere for a month before turning up. The two exceptions with no weakness at all are the two most recent: 2024, when gold gained about 12 percent into late October, and 2025, when it gained about 25 percent into its October top. Anyone who checks only the last two years will conclude the pattern is broken. Anyone who checks fifteen will see that the last two are the outliers.
What separates the two columns is not the holiday. In 2024 and 2025, gold was in the middle of a rally that had not topped yet. In the ten "lower" years, gold had already made its high for the move, sometimes days earlier (2011, 2013, 2017, 2019), sometimes months earlier (2016, 2020, 2022, 2023). Labor Day did not cause those declines. It fell at the point in the year when the rally had already run out and the September calendar took over.
That is why the second half of the pattern matters more than the first. The three or four weeks after Labor Day have been reliably weak. What happened after early October depended on where gold stood in its cycle, and that brings me to the year that looks like this one.
The 2012 Link
Gold's 2011 top and its 2013 collapse were separated by a two-year structure that is easy to see in hindsight: a blow-off high, a sharp first decline, a rebound, a lower low, and then a long corrective rally that convinced most of the market the bull was back. That rally topped on October 4-5, 2012, a month after Labor Day, on the back of the Fed's QE3 announcement, and it was the last rally of the bear market. What followed was a six-month grind to $1,560 and then the April 2013 crash, which took gold to $1,180 by June.
The same structure has played out this year: the blow-off top in January, the first decline into March, the rebound in April, the lower low in early July, and the corrective rally into late August that brought the bull-is-back narrative with it. What differs is the speed. The 2011 top and the 2012 corrective top were thirteen months apart, and this year's were seven months apart. If the compression holds, the six-month grind that preceded April 2013 would be closer to three.
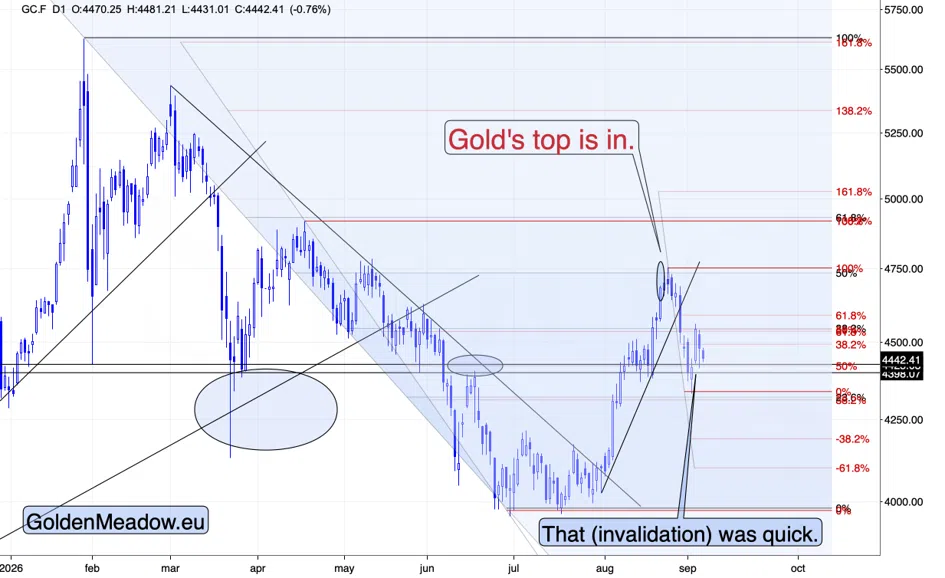
I marked the corrective top of 2012 on the long-term chart as the key analogy for a reason. In 2012, Labor Day came before the corrective top and the top arrived within a month. This year, the corrective top came before Labor Day. Gold is running ahead of its own script.
Why This Year Belongs In The Lower Column
Three things put 2026 with the ten "lower" years and not with the two exceptions.
Gold has already topped. The record close was January 28, and the late-August high near $4,730 was a corrective top inside a decline, not a new high. The brief move above the declining resistance line on the futures chart was invalidated within days. This is the 2011, 2013, 2019 configuration, not the 2024, 2025 one.
The rate channel is running against it. The September FOMC falls within two weeks of Labor Day every year, and this year it comes with a hike on the table: the odds ended last week near 60 to 65 percent after August payrolls printed 162,000, the two-year yield closed at its highest since January 2025, and the USD Index held the breakout it made in late August, reversing higher on the payrolls after the yen rally had pulled it to a 61.8% retracement. On Friday, I wrote: "The headwind that produced yesterday's decline is still blowing, and the index is moving into it." It still is.
The internals are the topping kind. Silver led Thursday's rally and led Friday's decline, which is the sequence it has delivered at this year's tops. The GDXJ's two-day bounce carried it to $132.3, within a dollar of the $133 daily-close level I published as the last-resort exit, and it closed 2.49 percent lower the next day. On Thursday, I wrote: "This dynamic: miners weaker than gold and silver stronger than gold has 'watch out, it's a fake rally' written all over it." It was.
And this morning, with Iran having fired ballistic missiles at a US aircraft carrier on Saturday and the US having sunk an Iranian tanker in reply, gold is trading below Friday's close. A market that will not rally on that headline is a market whose buyers have already spent their reasons.
What The Analogy Implies
If 2012 is the template, the near-term move is a grind, not a collapse. The six months after the October 2012 top took gold down about 13 percent in a slow, frustrating decline before the crash phase arrived, and the head-and-shoulders target near $4,100 that I described on Friday sits comfortably inside that kind of move. In our case, this back-and-forth decline stage could take 4-6 weeks. The larger targets (like $3,500) come later, and they come after the grind has exhausted the buyers who are still treating every dip as an entry.
My outlook and positions are unchanged, and the profit-take levels remain in place.
The holiday itself changes nothing. What it marks is the point on the calendar where, in ten of the past fifteen years, gold's buyers discovered the rally was already over. This year, they are discovering it ten days late.
There’s a tremendous profit potential in all this, especially when you look at the situation from the long-term point of view, which is what we do in the Gold Trading Alerts. If you’re not ready to subscribe yet, I encourage you to sign up for our free gold newsletter.
Sincerely,
Przemyslaw K. Radomski, CFA