Several markets are now sitting right on top of make-or-break technical levels.
The U.S. dollar is pulling back after a strong breakout, while gold, silver, and platinum are trying to stabilize at major support zones. Momentum on the 4-hour charts is beginning to improve for the metals, with fresh buy signals and positive divergences hinting that a short-term rebound may be close. Still, none of these bullish scenarios are confirmed yet and today’s closing prices will likely decide whether this is the start of a recovery or just a brief pause before the next leg lower.
U.S. Dollar Index (DX.F)
Let’s begin with the quote from Friday’s commentary:
“(…) So, what comes next?
As long as the 4-hour chart remains free of sell signals and the daily chart continues to flash active buy signals, the next logical target appears to be 99.30, which corresponds to the 61.8% Fibonacci retracement. (…)”
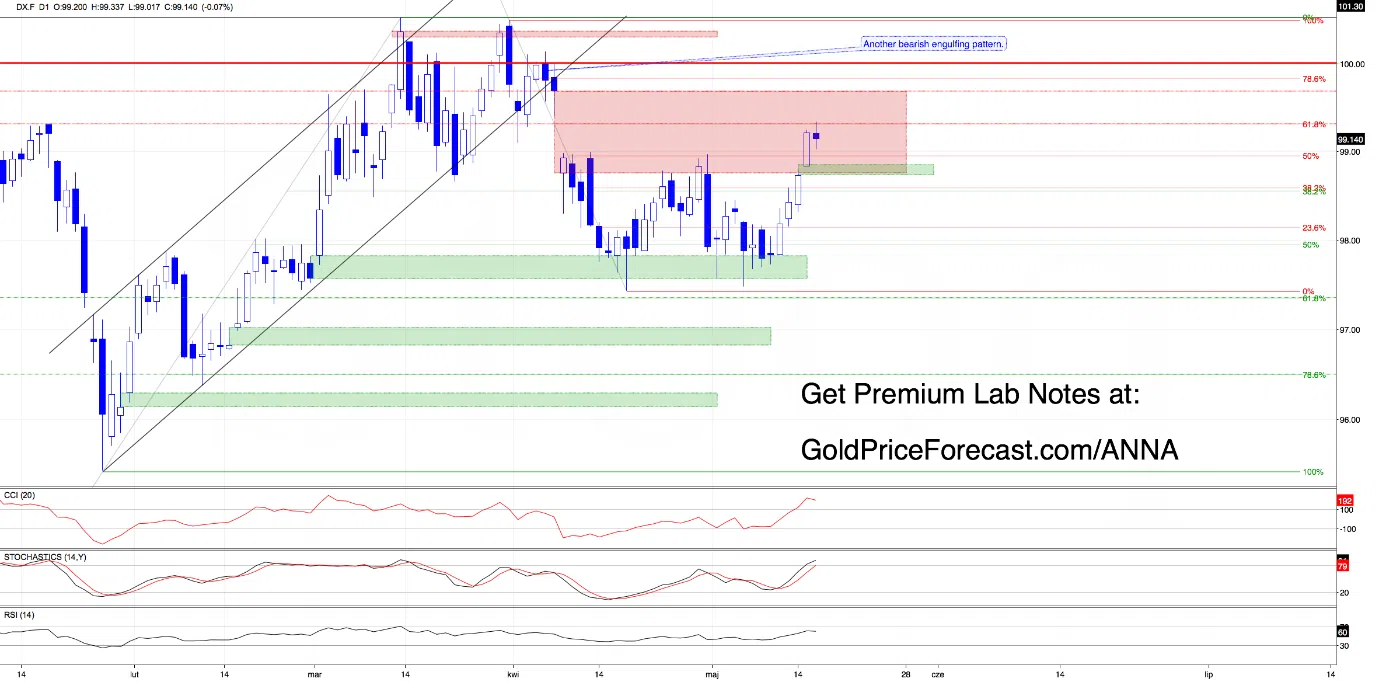
Looking at the daily chart today, we can see that the situation developed exactly in line with our scenario. Bulls reached the next upside target and challenged the 61.8% Fibonacci retracement.
For now, that first attempt has stalled.
The dollar was unable to push through this resistance on the first try and has started to pull back toward the previously broken April highs.
So, could it happen next?
As long as we do not see an invalidation of the earlier breakout, and as long as Friday’s bullish gap remains open, buyers are still the team in control and have every chance to launch another attack on this resistance zone.
Nevertheless, there is one more important technical detail worth highlighting on the weekly chart.
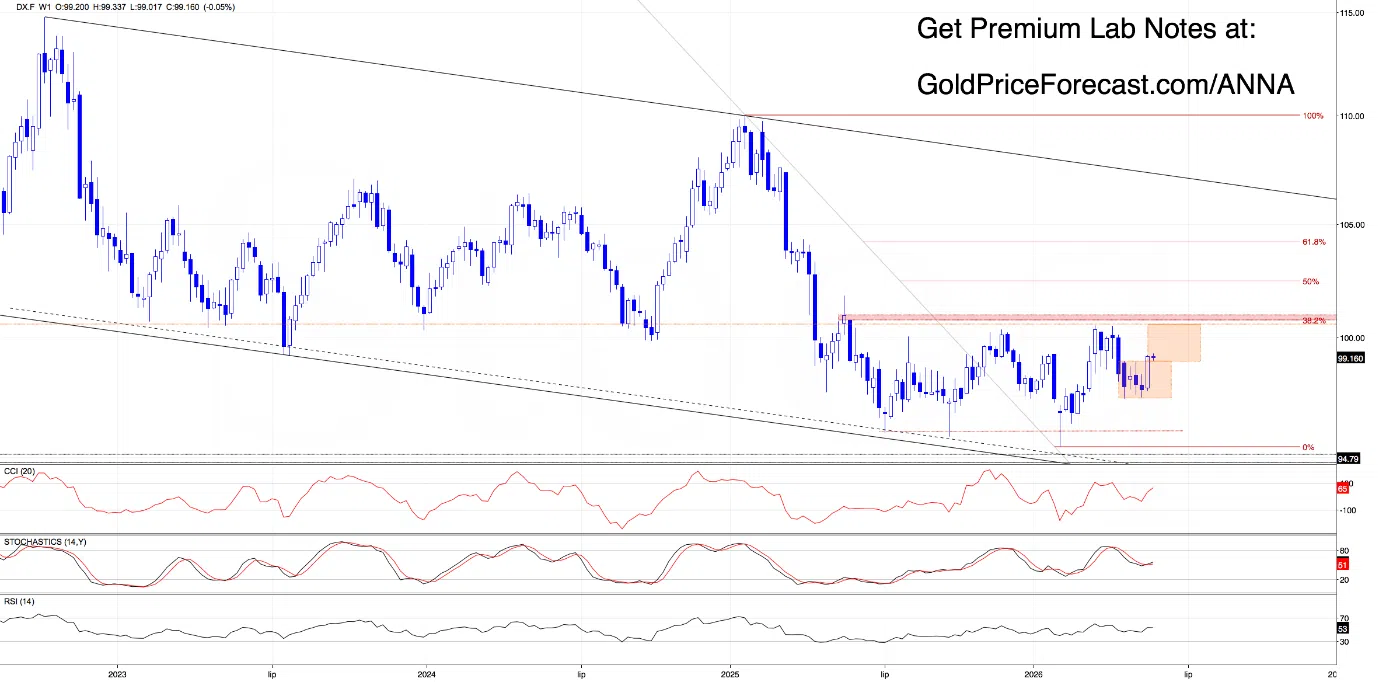
From that broader perspective, we see that last week’s rally pushed the dollar above the upper boundary of the orange consolidation.
That means today’s pullback may simply be a healthy retest of Friday’s breakout rather than the start of a larger reversal and that is precisely why the current levels matter so much.
If bulls manage to finish this week above 99.00 - the upper boundary of that long-standing consolidation - the next logical step would likely be a breakout above 100 and a potential test of the March high.
On the other hand, if buyers lose control, we should be prepared for a deeper pullback toward the upper boundary of the green rising channel, currently near 98.68. However, a break below this important support could open the door to 98.45.
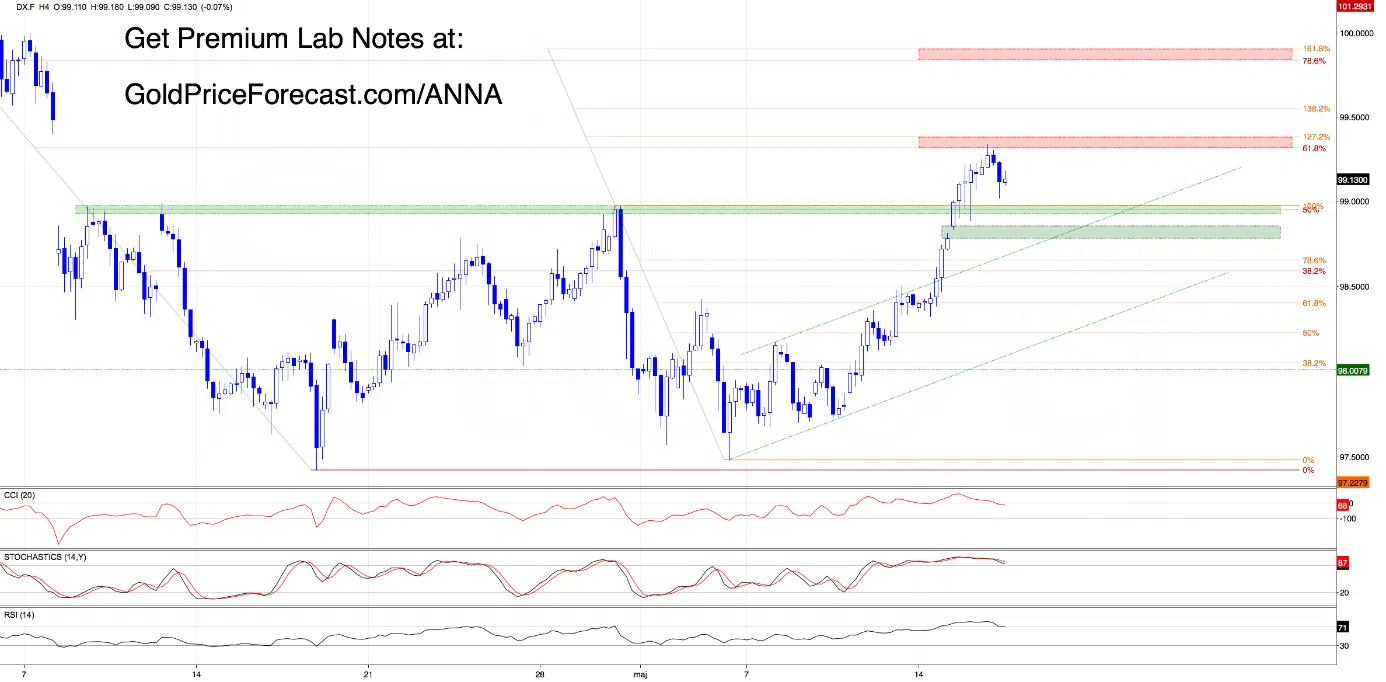
Before we move on to gold, one final note: the 4-hour chart has already generated fresh sell signals, which increases the pressure on bulls. Therefore, if bears manage to close the day below 98.72, a test of the upper boundary of the former rising channel may become only a matter of time.
Gold (GC.F)
Let’s start with the quote from Thursday’s commentary:
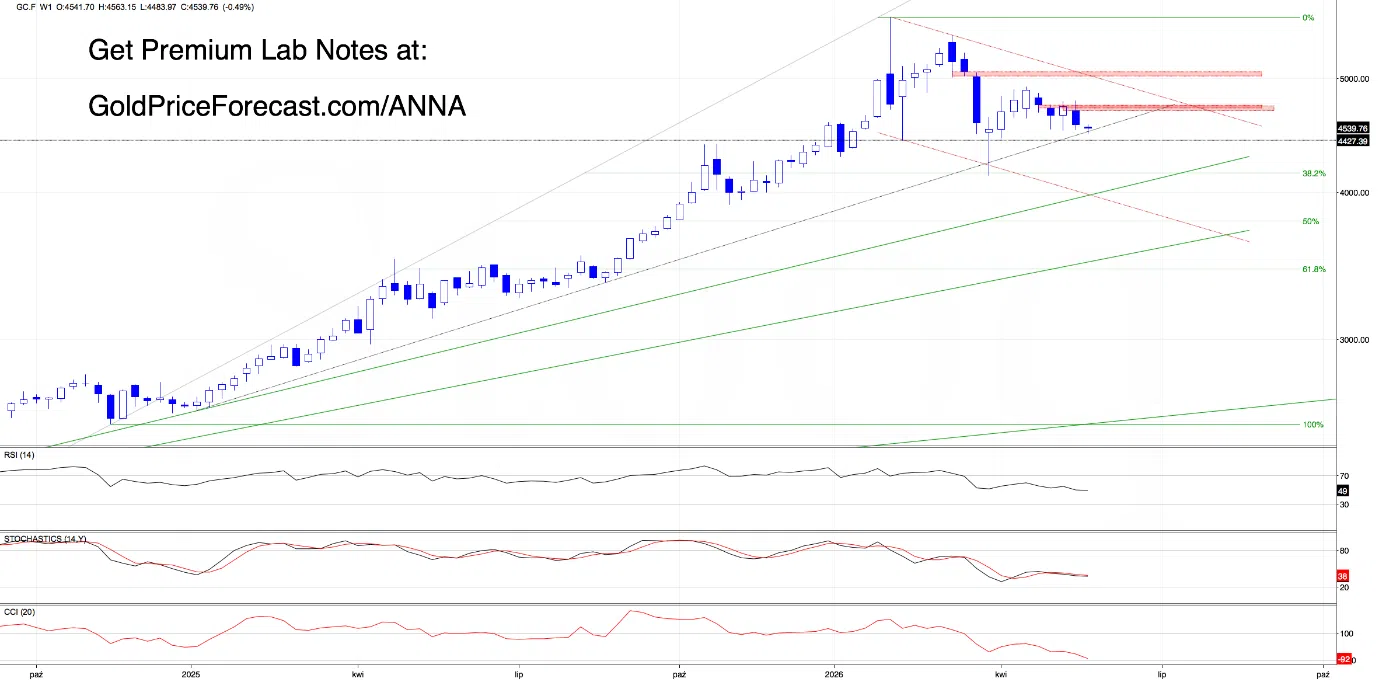
“(…) close below the lower boundary of the range (bearish scenario) would likely trigger a sharp deterioration in the technical picture and could quickly bring the 4500 level into focus. (…)”
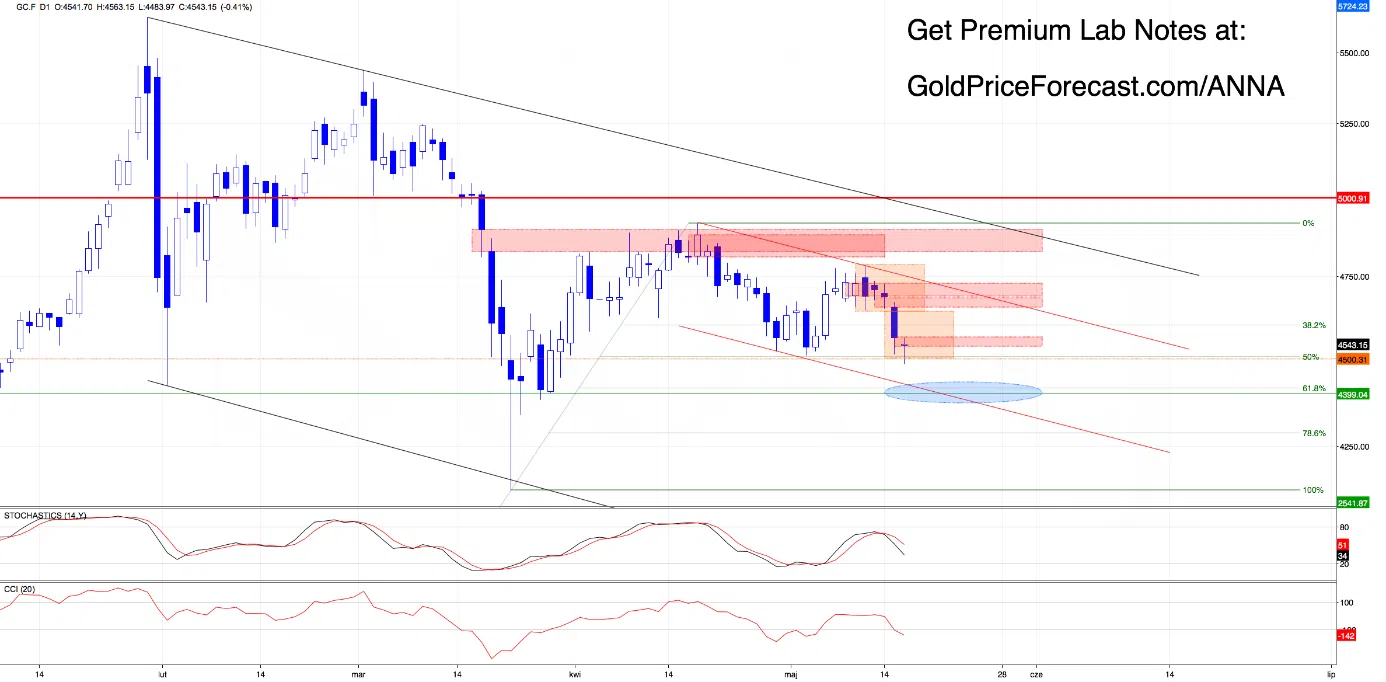
Looking at the daily chart, we see that bears did exactly what they were supposed to do. Gold tested the 4,500 level and successfully reached our downside target (congratulations to everyone who trusted the bearish scenario and used the move to lock in additional profits!).
With today’s decline, gold also tested:
- the 50% Fibonacci retracement, and
- the key long-term support line we first highlighted on May 5 (as a reminder, this trendline is based on the January and August 2025 lows and reinforced by the April bottom).
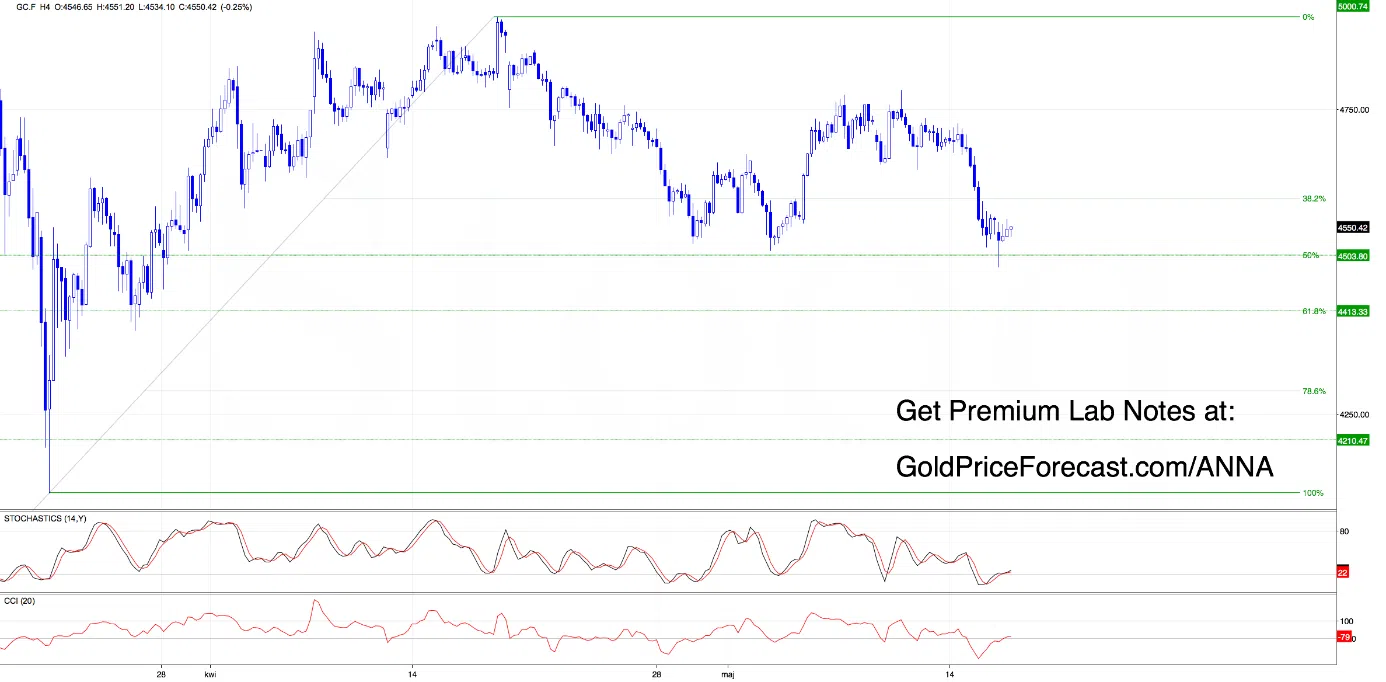
Taken all the above together with what we now see on the 4-hour chart - positive divergences on both CCI and Stochastics, along with fresh buy signals - the setup suggests that a bullish counterattack may be just around the corner.
That said, there is one important obstacle standing directly overhead… at the start of today’s Asian session, a small bearish gap formed between 4,541 and 4,561. Therefore, if buyers want to regain momentum, this gap must be closed.
Today’s Takeaway
For the U.S. Dollar Index
- Watch 98.72-98.68 because this is the first key support zone.
- As long as price holds above this area, bulls remain in control despite the current pullback.
- Break back above 99.30 -> opens the door to 99.69 (upper border of the major April bearish gap).
- Weekly close above 99.00 -> strengthens the case for an eventual move toward 100.00.
- Daily close below 98.72 -> increases the odds of a deeper pullback toward 98.45.
Bottom line: The bigger picture remains bullish, but the very short-term sell signals suggest the dollar may need to cool off before the next push higher.
For Gold
- Watch the 4500-4561 support zone very closely.
Now you can check the full version for 7 days - completely free. If it helps you think clearer, stay with us. If not - cancel in one click. Zero pressure. 100% value.
The door is open whenever you’re ready.
👉 Premium Access: Anna’s Trading Lab
Stay calm, trust the process, and let the levels do the work.
Anna