Miners ended the Aug. 31 session in the red, as the GDXJ ETF declined by 0.99% and the GDX ETF by 0.88%. Likewise, gold and silver sank by 0.36% and 1.16%, respectively.
Furthermore, while the pivot crowd assumes 2023 is a lot like 2021 and 2022, the economic backdrop is much different now, and recession watch has officially begun.
Bad News Is Bad for Gold
With the crowd still exhibiting soft landing optimism, the ‘bad news is good news’ mantra has returned to the financial markets. If you’re unfamiliar, the phrase means that weak economic data is positive because it will allow the Fed to pause and/or cut interest rates, which is bullish for risk assets. As such, the S&P 500 and gold lauded the recent data dip.
However, that analysis is shortsighted, and it’s likely only a matter of time before bad news results in bad outcomes for the PMs. To explain, JOLTS job openings sunk on Aug. 29 and came in well below economists’ consensus expectations. In addition, consumer confidence declined materially as inflation and higher long-term interest rates eat away at Americans’ disposable incomes.
Please see below:

Yet, the crowd often opines that ‘the stock market is not the economy’ despite years of mounting evidence to the contrary. Consequently, don’t be surprised when a recession rains on the bulls’ parade, and silver suffers during the downpour.
Please see below:

To explain, the black line above tracks JOLTS job openings, while the red line above tracks the S&P 500. As you can see, the pair largely moved in lockstep for more than 20 years. But, with a major divergence present on the right side of the chart, the S&P 500 assumes that the connection no longer matters.
Although, please remember that JOLTS should decline significantly in the months ahead, making the gap even worse. Furthermore, job openings are a leading indicator of consumer demand, because when demand is robust, companies respond by increasing their workforce to match their order books. In contrast, when demand weakens, they reduce job openings, as their current staffing is sufficient.
Moreover, lower job openings are the first step to a rising unemployment rate. After employers reduce their openings to match weaker demand, a continuation of the theme results in furloughs and layoffs. As such, while we warned that higher long-term interest rates are the perfect ingredient for a recession, a spike in unemployment should rattle the bulls and uplift the USD Index.
For context, we wrote on Oct. 6, 2021:
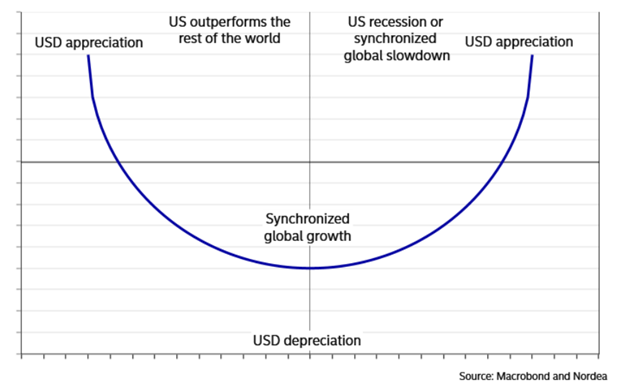
The USD Index’s fundamental strength is underwritten by the ‘dollar smile.’ When the U.S. economy is trudging along, the U.S. dollar tends to underperform. However, when the U.S. economy craters and a safe-haven bid emerges, the U.S. dollar often outperforms. Conversely (and similarly), when the U.S. economy is booming and higher interest rates materialize, the U.S. dollar also outperforms.
Please see below:
Thus, while part one of our fundamental thesis unfolded as expected (hawkish Fed, higher real yields), the second part is underway. Now, the crowd still assumes that ‘bad news is good news,’ so the price action does not reflect the economic scars. Yet, in the months ahead, a crisis of confidence should unfold, and the S&P 500 should come under heavy pressure.
Please see below:

To explain, the brown line above tracks the U.S. unemployment rate, while the gray line above tracks The Conference Board’s inverted (down means up) labor differential. For context, the latter tracks the spread between Americans that say jobs are “plentiful” versus jobs are “hard to get.”
If you analyze the relationship, you can see that when the labor differential sinks (gray line rises), the U.S. unemployment rate has not been far behind. More importantly, the labor differential hit a new cycle low on Aug. 29. The gray line has risen materially, and like JOLTS, it should only worsen in the months ahead.
Don’t Quit
While trudging through challenges signals perseverance, when Americans stick with their employers, it’s a sign that economic weakness has spread.
Please see below:

To explain, the black line above tracks nonfarm quits. For context, the metric tallies the number of Americans who voluntarily leave their jobs each month. In a nutshell: when employment opportunities are robust, Americans jump from one job to another and capture the salary gains. Consequently, it’s no surprise that record quits in 2021/2022 culminated with record wage inflation (according to the Atlanta Fed).
But, if you analyze the right side of the chart, you can see that those days are long gone. Quits have collapsed over the last two months and are now below their pre-pandemic highs. Furthermore, notice how falling quits coincided with the last three recessions?
So, while we faded the recession hysteria throughout 2021 and 2022, that was due to a robust labor market and rampant wage inflation enhancing consumers’ spending power. However, these metrics have weakened materially, and they should only worsen the longer long-term interest rates remain high.
Overall, investors are blinded by the fallacy that weaker data is bullish because the Fed can pivot. History shows that when dovish pivots occur, liquidations are already underway across the financial markets. Therefore, when bad news becomes bad news again, don’t be surprised if the next bout of panic sinks assets like crude oil, stocks and the PMs, and uplifts the USD Index.
Although, the fundamentals are only half the battle. And while they are extremely useful over three to six-month time horizons, the technicals are more efficient at predicting short-term moves and determining precise entry and exit points. Our daily Gold Trading Alert (GTA) covers these issues in great detail and our unique analysis has helped subscribers realize 10-straight profitable trades (unleveraged).
More importantly, each subscription includes a free seven-day trial, and you can cancel at any time.
The Countdown to Silver’s Crash
Like mining stocks, silver is sensitive to volatility. And with the ‘bad news is good news’ optimism filtering through the financial markets, the narrative has aided the white metal.
Please see below:

To explain, the gray line above tracks the silver futures price, while the black line above tracks the inverted (down means up) Cboe Volatility Index (VIX). If you analyze the relationship, you can see that silver has largely moved opposite to the VIX for roughly 12 months. And with lower volatility reigning in recent days, silver sees few reasons not to celebrate.
Despite that, we mentioned that recession winds have begun to blow, and gold is far from immune. Consequently, while the price action seems bullish, the bearish fundamentals continue to head in an ominous direction. To explain, we wrote on Aug. 24:
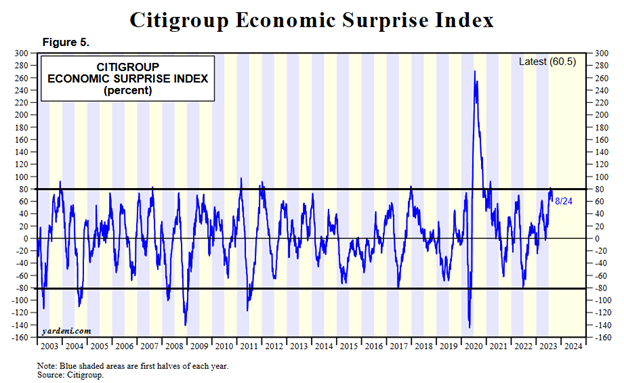
The blue line above tracks Citigroup’s U.S. Economic Surprise Index (ESI). For context, a surprise occurs when a data point outperforms economists’ consensus expectations. And with the metric peaking near 85, the recent run of hot data is on par with the highs seen over the last ~20 years.
However, if you analyze the movement of the blue line after reaching these heights, you can see that sharp drops often followed, and readings near -80 can materialize. As a side note, the metric was much more volatile during the pandemic, as base effects played a key role. As a result, -80 to +80 is a more appropriate range.
The moral of the story is that while Europe looks poised for an abrupt recession, the U.S. may not be far behind. When interest rates were too low, they helped the ESI soar as relatively cheap money made borrowing more affordable. Although, the recent rate surge means those days are over, and major volatility should be on the horizon.
To that point, it’s been roughly a week, and the metric has already declined materially.
Please see below:

To explain, the ESI has fallen from 60.5 on Aug. 24 to 46.4 on Aug. 31. Furthermore, it was north of 80 two weeks ago. As such, if (when) it crashes into deeply negative territory, investors’ calm should dissipate, and the VIX and the USD Index should soar.
Likewise, September is often the worst month for the S&P 500 during the third year of a presidential cycle.
Please see below:

To explain, the red bar near the right side of the chart shows how the S&P 500 often loses more than 1% in September (since 1928), as poor performance dominates. Moreover, the blue line above shows how September rallies only occur 39.1% of the time, which is the worst of any month.
In addition, this occurs alongside VIX seasonality, which is bullish in September and October. We wrote on Aug. 24:
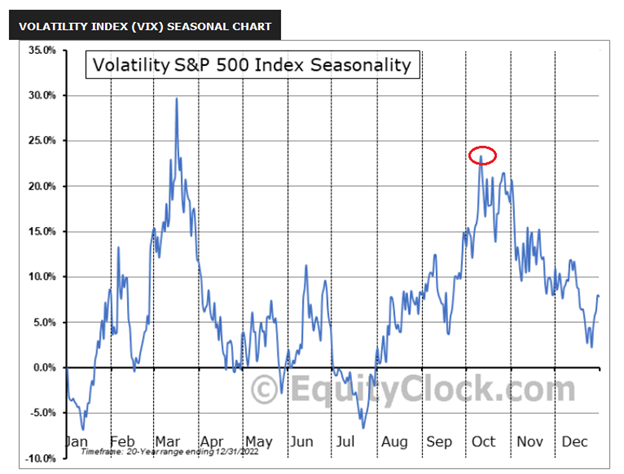
If you analyze the red circle on the right side of the chart, you can see that it often peaks in early October. Consequently, we’re not even halfway through the VIX’s typical seasonal surge, and if history repeats, it’s profoundly bearish for the S&P 500 and silver.
The Rates Conundrum
While it may seem confusing, it’s important to distinguish when lower interest rates are bullish and bearish for the PMs. When the U.S. economy is resilient, and the Fed is doing QE, the fundamental backdrop is bullish for the PMs because lower interest rates reduce the opportunity cost of owning gold (it’s non-yielding), weaken the USD Index, and enhance inflation.
However, when an economic calamity unfolds, lower interest rates are bearish for the PMs because Treasuries are the main beneficiaries when panic strikes.
Please see below:

To explain, the black, gray and gold lines above track the iShares 20+ Year Treasury Bond (TLT) ETF, silver and the GDXJ ETF before and after the COVID-19 crash. If you analyze the vertical gray line near the middle of the chart, you can see that TLT soared as silver and the GDXJ ETF plunged. As a result, while we successfully predicted that lower TLT prices were bearish for the PMs in 2021 and 2022, when the recession arrives, the opposite should have the same bearish ramifications.
Overall, oil prices have rallied as the crowd assumes that weaker data is a good thing. But, long-term interest rates have largely ignored the recent data dump, meaning that little has been done to reverse the recent rate rally. Consequently, if one month of higher long-term Treasury yields did this much damage to the U.S. economy, imagine how bad the data will be by year-end. Thus, the fundamentals continue to unfold as expected, and we think a major recession will occur before this cycle ends.
In the meantime, the technicals are our North Star. While fundamental analysis provides immense value over monthly timeframes, technical analysis better predicts turning points and generates short-term alpha. As an example, our subscribers have booked 10 profitable trades in a row (unleveraged), as our entry and exit decisions have proven prescient over almost 2 years…
Today’s premium Gold Trading Alert includes details of the current trading position in the precious metals sector – one with enormous potential. I invite and encourage you to subscribe and read those premium details today.
The Bottom Line
The crowd remains sanguine for the time being, as the thought of a dovish Fed garners all of investors’ attention. However, we warned repeatedly that a higher U.S. federal funds rate (FFR) is not what causes recessions, it’s higher long-term interest rates. And with borrowing costs rising dramatically, consumers have less money to spend, and we’re already seeing the effects in the job openings data. As such, we’re likely in the second inning (of nine) of what should be a cold winter for the soft-landing bulls.
In conclusion, the PMs declined on Aug. 31, as silver and mining stocks led the move lower. And with the USD Index rallying sharply, more pain should confront the PMs before long-term buying opportunities emerge.
Alex Demolitor
Precious Metals Strategist