This one’s for the history books:
Gold and silver plunged in the aftermath of the escalation of the military conflict in the Middle East.
That’s exactly what happened this week.
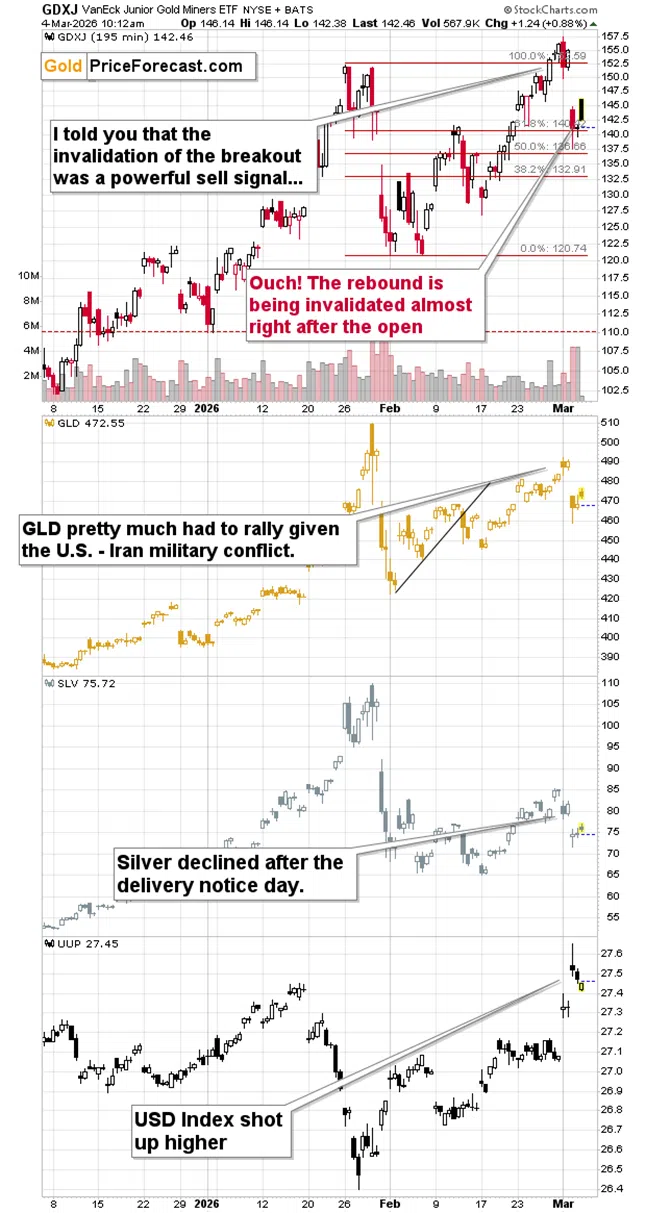
The GDXJ moved below its mid-Feb. high after failing to hold above its January top. The breakout’s invalidation was a strong sell signal, and it’s completely normal that we now see a sharp decline.
Remember how I wrote that due to higher correlation values, silver and miners would be likely to decline more when the USD Index rallies? We see this in practice today.
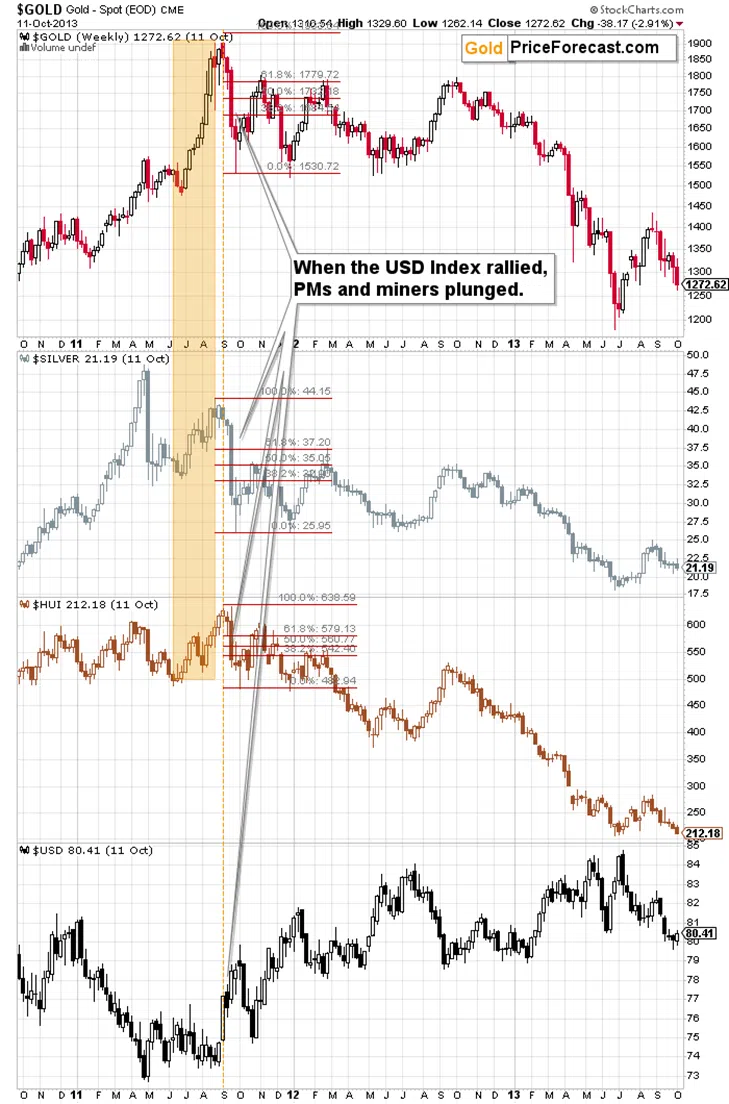
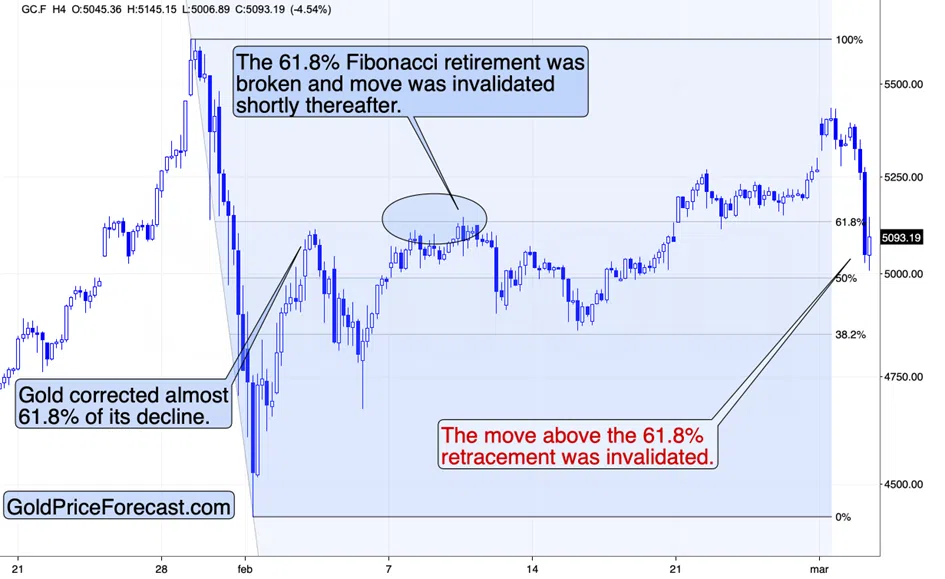
Gold’s and silver’s performance is just as unsurprising if you look at technicals. Gold was forced to rally when the U.S. attacked Iran, so it did. But it never completely broke its technical link with the post-2011 top.
Yes, gold moved above the 61.8% Fibonacci retracement, but it didn’t move above its previous high, and it already moved back below the said retracement.
Silver’s technical link to 2011 is even clearer.
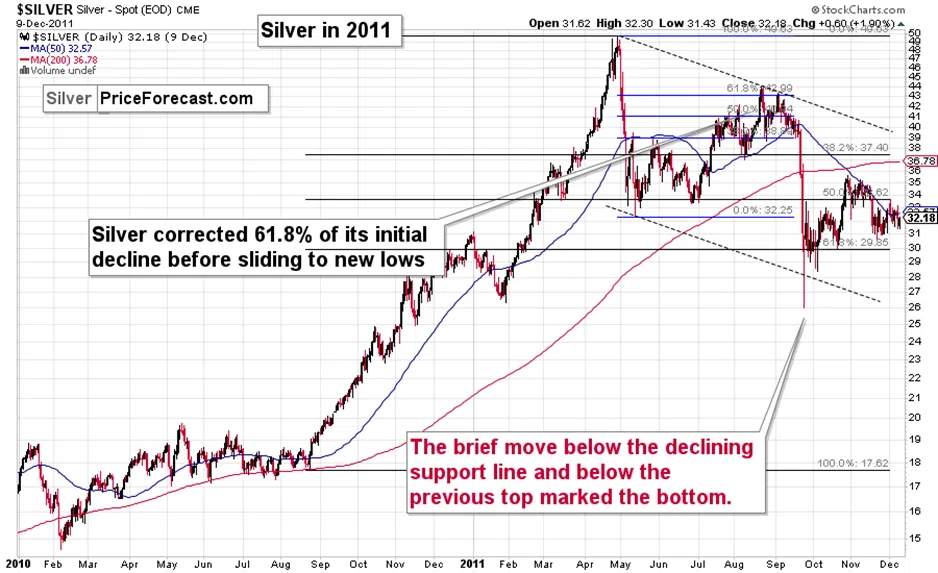
Please note how silver topped slightly above its 61.8% Fibonacci retracement in August 2011. And now?
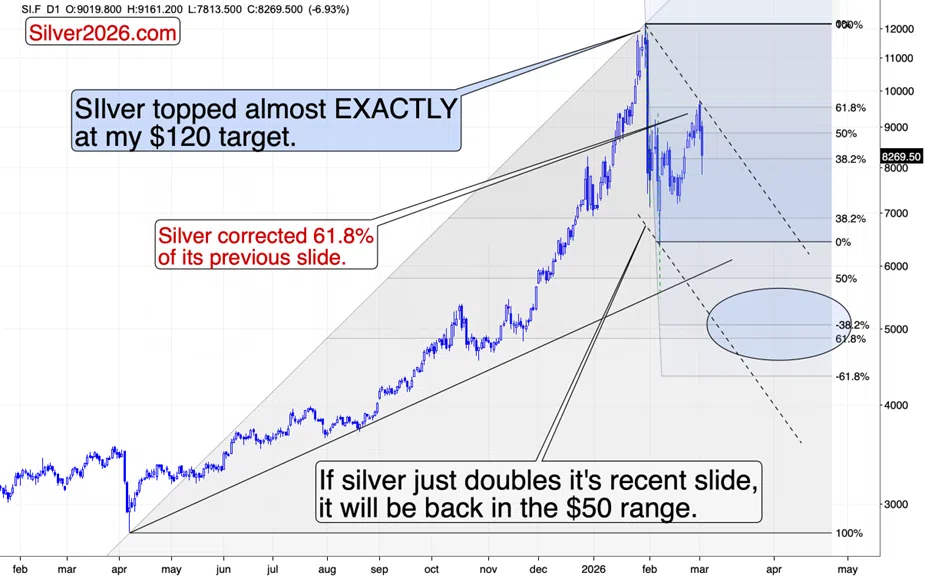
We saw the same thing.
What took weeks then, now only takes days, but overall, I’m sure you’ll agree that the patterns are remarkably similar – including the price move that led to the final top.
If this is to continue, then we have a good indication where silver might bottom.
There were three technical developments that stopped silver’s sharp decline in 2011:
- The move below the 61.8% retracement based on the medium-term rally
- The move below the lower border of the declining trend channel
- The move below its previous local low
Since the pattern is very similar right now, the above-mentioned support levels also align in a similar way.
In short, they are all a bit below $50. Precisely, the declining support line is still above $50, but before silver gets to it, it’s likely to be below $50, anyway.
Please note that back in 2011, silver was below those levels very briefly – it might be the same thing with the $50 level this time. Right now, in my opinion, any move below $50 in silver should be treated as exceptional opportunity to buy silver.
Having said that, let’s take a look at this week’s key technical development.
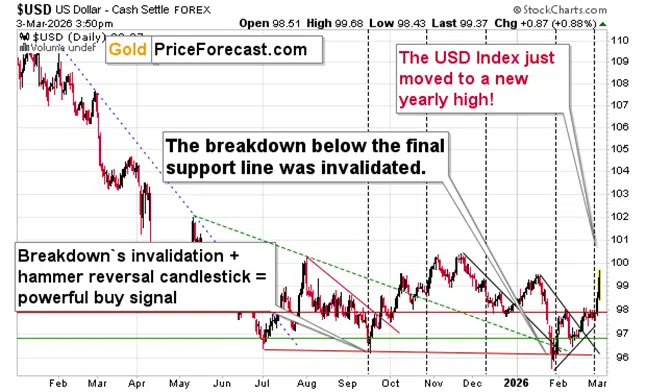
I mean the fact that the USD Index just broke to a new 2026 high. Today’s intraday high was 99.68, which is very close to the key – 100 – level. Once this is broken and the USD Index trades above it for several days, the really big moves will start on many markets. Very few people are prepared for it, and you are among them.
Please note how the USD Index broke above its declining, medium-term resistance lines based on the 2025 highs, and at the same time, it moved back above the rising, long-term support line.
Thank you for reading today’s free analysis. I’ll continue to send you occasional updates and, as always, I’ll keep my Gold Trading Alert subscribers informed at all times.
Thank you.
Przemyslaw K. Radomski, CFA
Founder
Golden Meadow®