


Sometimes the most interesting market signals come from comparing two charts rather than studying one in isolation.
Last week, the U.S. dollar broke above an important weekly technical boundary. But when the week ended, the breakout hadn't survived. Now copper is testing a different kind of critical boundary: the lower line of a rising wedge that could have serious implications if buyers fail to defend it.
The situations aren't identical. One has already delivered a confirmed warning; the other is still awaiting a decision. But both remind us of something important:
A technical formation matters most when the market confirms what happens at its boundaries.
Let's look at what the dollar has already told us and what copper might be preparing to reveal.
U.S. Dollar (DX.F) - The Weekly Warning Is Official
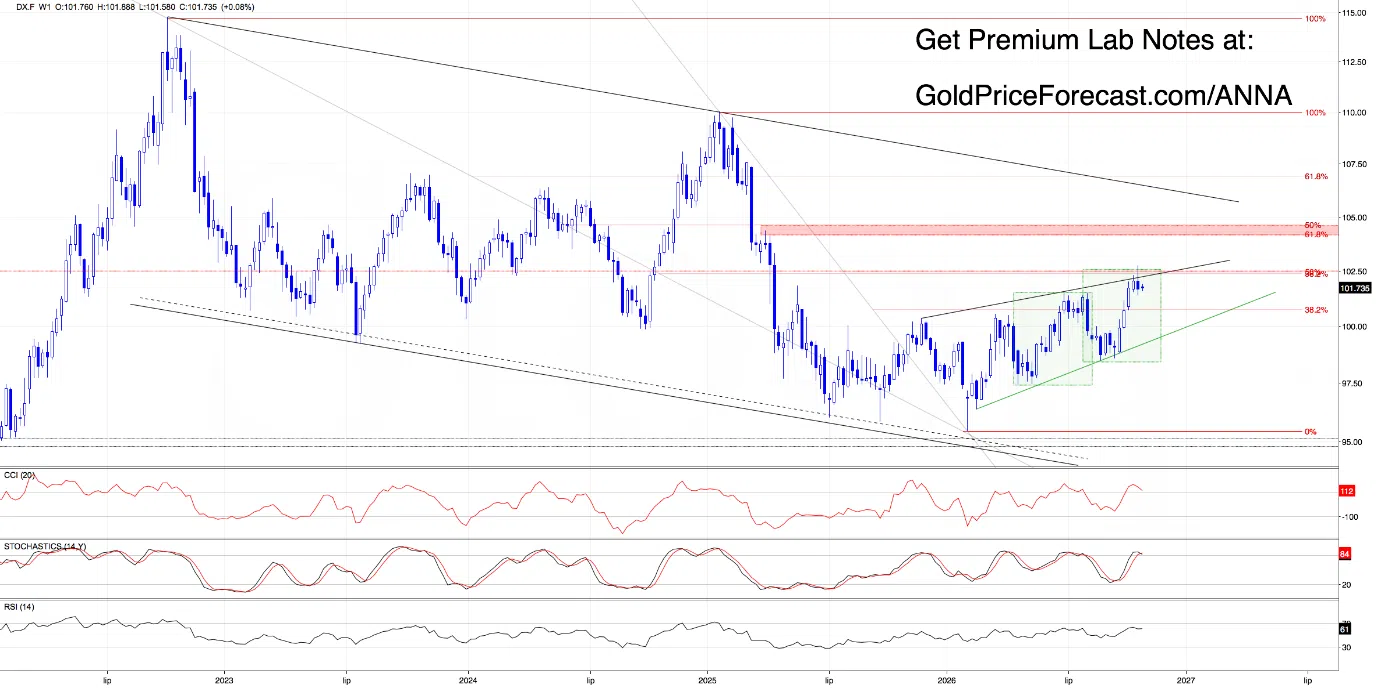
Remember our discussion in Wednesday's Lab? We warned that pushing above the upper boundary of the weekly rising wedge wasn't enough: the weekly close would determine whether that breakout could be trusted.
Friday supplied the answer. The dollar closed back below the wedge's upper line, confirming the invalidation of its earlier breakout. A weekly Stochastic sell signal and a negative divergence on CCI add weight to that warning. These developments weaken the bulls' position, but they do not, by themselves, confirm a fresh downtrend.
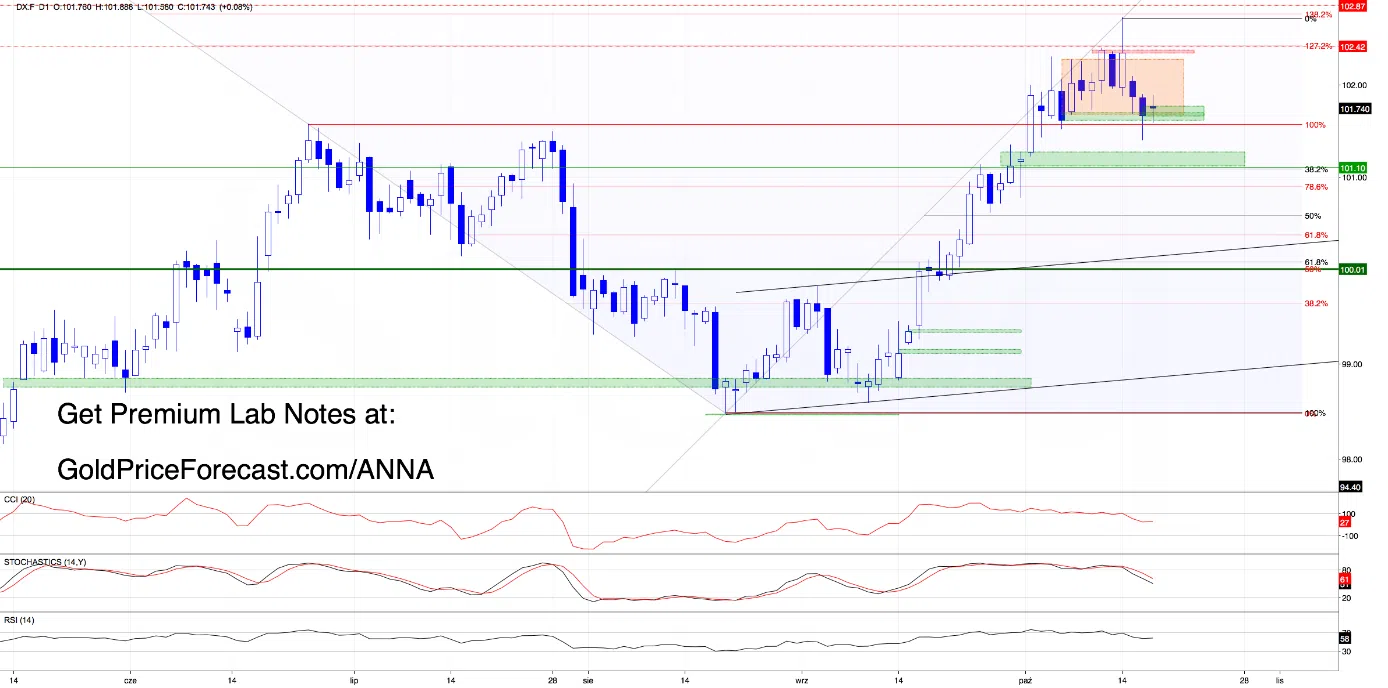
On the daily chart, the battle remains much closer. Friday closed at 101.65, inside the October 7 bullish gap at 101.60-101.70 and above the June-July highs at 101.49-101.57. There was one less encouraging detail: that close was just below 101.67, the lower boundary of the orange consolidation at 101.67-102.27. A tiny difference, yes - but technically still a close below support.
Monday opened with another bullish gap at 101.65-101.76, suggesting that buyers want to recover that boundary. However, the dip to 101.58 has already tested the new gap and slipped briefly beneath the older one. Neither gap has a confirmed daily closure on the current evidence. More importantly, buyers have not yet surrendered the structural support at 101.49-101.57. Daily momentum is attempting to recover even as the weekly signals warn against overconfidence.
The next decision: sustained recovery above 101.67 would keep 102.27 and 102.36-102.49 in view. A daily close below 101.49, confirming the loss of the support zone and older bullish gap, would strengthen the bearish case toward 101.10, where the 38.2% Fibonacci retracement meets the approximate measured move from the orange consolidation.
Daily Takeaways
- Weekly: confirmed invalidation of the wedge breakout; bearish momentum warnings.
- Daily support: 101.60-101.70 and 101.49-101.57; a close below the latter would increase downside risk toward 101.10.
- Recovery hurdles: 101.67, 102.27, then 102.36-102.49.
Bottom Line: The weekly chart has issued its verdict. The daily chart says the bulls are still defending their last important ground.
Copper (HG.F) - A Small Range, a Potentially Big Decision
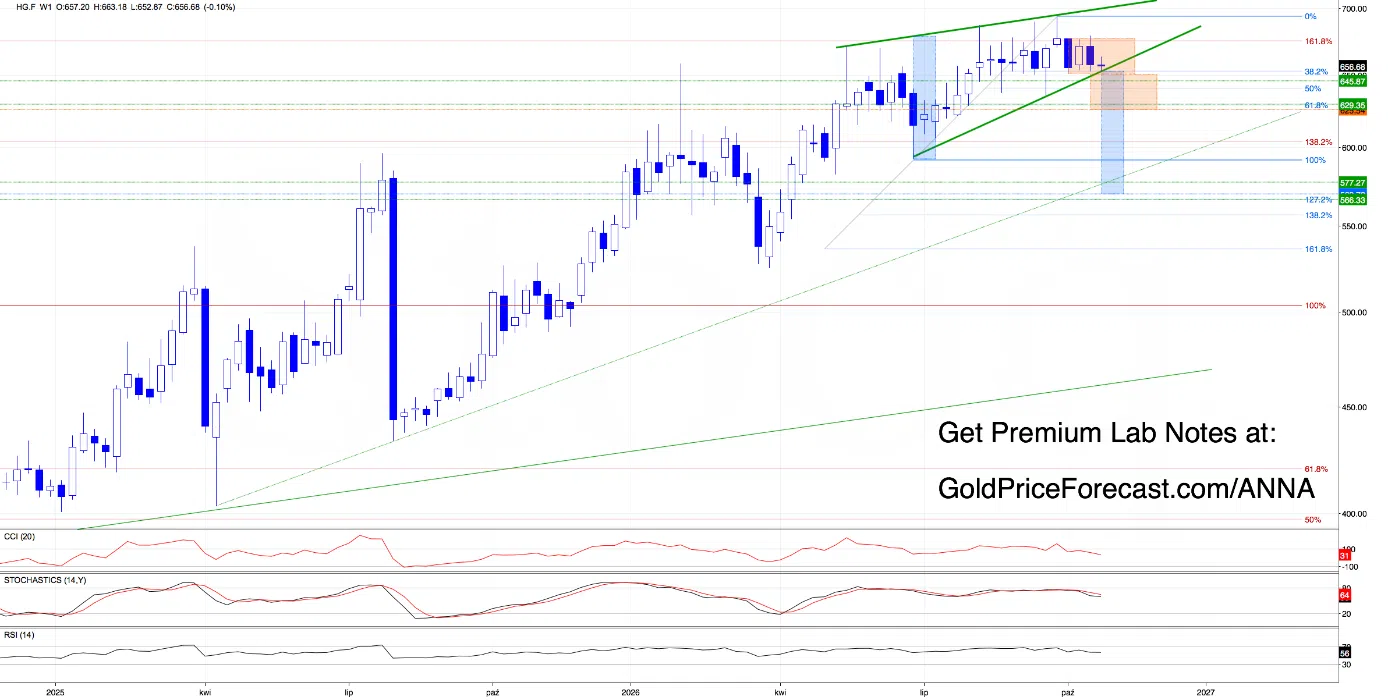
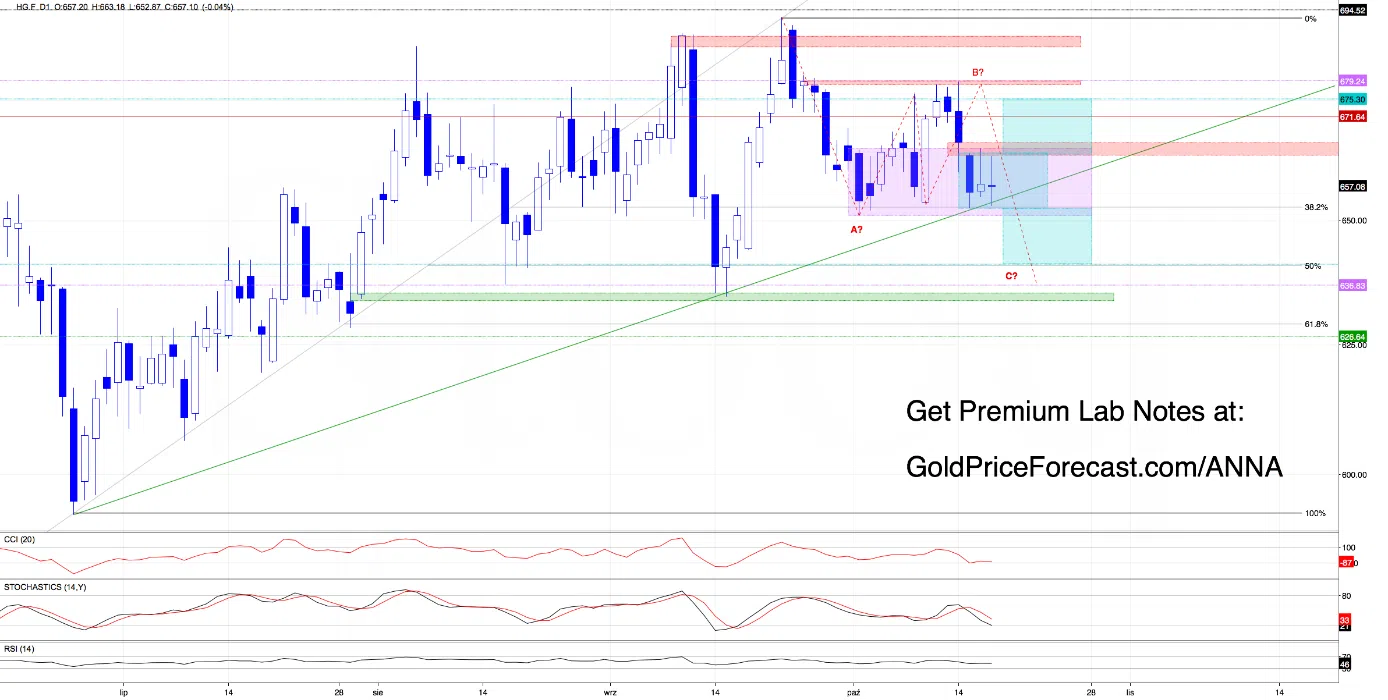
Copper's daily chart has kept us busy with a potential bearish A-B-C correction toward 637, assuming wave C equals wave A - a possibility we introduced in Tuesday’s Lab. But a fresh look at the weekly chart reveals an even more consequential structure: a rising green wedge whose lower boundary is now being tested.
Nearby sits the lower edge of a weekly orange consolidation around 650, giving buyers a particularly important defense zone. The wedge line slopes upward, so its precise level will change over time. What matters is a confirmed weekly close below both the consolidation and the wedge, not a fleeting dip or an automatic assumption that 650 is a permanent threshold.
If that double breakdown materializes, the first broader downside area would be 625-629: the approximate measured move from the weekly orange range alongside the weekly 61.8% Fibonacci retracement. A more prolonged decline could then challenge the rising support line near 577. Only after further confirmed weakness would the wedge's approximate minimum projection around 570, near the 127.2% Fibonacci extension at 566, become a credible longer-range objective. These are conditional stages, not a promise of an uninterrupted collapse.
Meanwhile, the daily chart shows a smaller blue consolidation squeezed between short-term support and resistance. Buyers have repeatedly defended the 38.2% Fibonacci retracement and still have the rising green trendline nearby. But daily sell signals keep the bearish alternative relevant.
If bulls break upward, a confirmed daily close above last week's bearish gap at 662.92-666.05 would open a path toward 675.30, then the repeatedly defended September 25 gap at 678.05-679. Our A-B-C hypothesis would remain technically valid until a confirmed daily close above 679.
If sellers break downward, losing the blue range and green rising support could direct price toward 641, where the daily 50% Fibonacci retracement meets the range's measured move, followed by our existing wave-C hypothesis around 637. A later weekly breakdown could then elevate the broader 625-629 scenario.
Daily Takeaways
- Daily crossroads: blue consolidation and rising support; upside confirmation above 666.05, downside risk toward 641-637 if support fails.
- Bearish hypothesis invalidation: a confirmed daily close above 679.
- Weekly risk: a close below both the rising wedge and the orange range near 650 could activate 625-629, with deeper levels only if the decline continues.
Bottom Line: Copper's daily chart may decide the next move; the weekly chart tells us why that decision could matter so much.
Beyond the Dollar and Copper
The rest of the metals market has its own unfinished business.
Gold successfully defended an important weekly bullish gap, yet its daily recovery is struggling. Silver remains beneath a broken declining channel, while platinum and palladium are showing different degrees of bullish strength after their recent rebounds.
What's particularly interesting is how many of these markets are approaching technical levels that could make the next move much more meaningful.
In today's Anna's Trading Lab Premium, we're following all six markets, their conditional scenarios, and the confirmations that would strengthen or invalidate our current interpretations. I invite you to sign up for the free trial today. And if you’re not yet on our free gold mailing list, sign up now.
Final Thought - Watch the Confirmation
The dollar's weekly chart has already demonstrated why a breakout deserves scrutiny until the close. Copper now faces a potentially important test of its own.
Neither chart gives us permission to assume what happens next, but both provide something more useful: a clear understanding of which technical developments would deserve our attention.
The market may supply the drama. Our job is to recognize the evidence.
Anna