While timing the financial markets is extremely difficult, our decision to turn our GDXJ ETF long position into a short position paid handsomely.
The junior miners’ index declined by 0.54% on Aug. 24, while the GDX ETF dropped by 0.21%, gold by 0.05%, and silver by 0.66%.
As a result, while channeling our inner bull proved profitable, we still think plenty of downside confronts the PMs before their bear markets end.
A Real Headache for Gold
While the crowd proclaimed that a new bull market was underway, we warned repeatedly that gold would confront resistance from rising real interest rates and a stronger USD Index. And with mining stocks often suffering the most, our GDXJ ETF long position – which marked the tenth consecutive profitable trade in a row – has flipped short once again. As a reminder, we wrote on Oct. 7, 2022:
The U.S. 10-Year real yield often peaks alongside the U.S. federal funds rate (FFR) (or near it). With the Fed poised to raise the FFR by at least another 1.25% (to reach 4.5%), the U.S. 10-Year real yield should have more room to run, which is bullish for the USD Index.
Please see below:
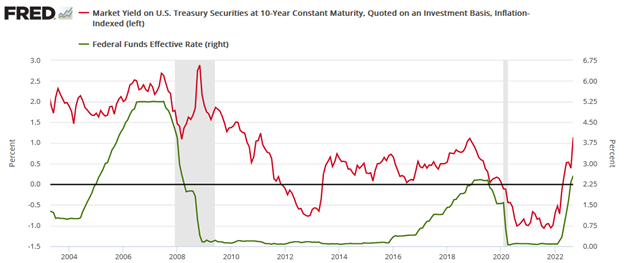
To explain, the red line above tracks the U.S. 10-Year real yield, while the green line above tracks the FFR. As you can see, a higher FFR supports higher real interest rates. Also, when the FFR hit ~4.5% in February 2006, the U.S. 10-Year real yield reached a monthly high of 2.14%, and it occurred with a year-over-year (YoY) CPI at roughly half the current rate.
To that point, with the prediction proving prescient, the U.S. 10-Year real yield hit 2% on Aug. 21, which was fundamentally bearish for silver and mining stocks.
Please see below:

To explain, the black line above tracks the U.S. 10-Year real yield. The metric hit its highest level since 2008 recently and its ascent further validated our bearish fundamental thesis. Therefore, while a short-term trading opportunity allowed us to capitalize on the recent reversal, the GDXJ ETF's medium-term trend remains lower, and we think more weakness lies ahead.
PMI Problems
S&P Global released its U.S. Composite PMI on Aug. 23. And with the headline index hitting a six-month low, oil prices have dipped as recession clouds have begun hovering over the U.S. economy. The report stated:
“Softer demand conditions were evidenced by the first decrease in new orders at U.S. firms since February. Manufacturers faced greater challenges driving demand as new orders fell at a quicker pace, while service providers saw the fastest drop in new business since the start of the year. Sustained pressure from inflation and high interest rates were often linked to the decline, with some firms also highlighting a greater need to invest in advertising to stimulate new sales.”
Furthermore, since we place an 85% probability of a recession occurring before this cycle ends, a realization should help propel the USD Index to new heights. We warned on Aug. 16:
While it may not be noticeable on the surface, higher long-term interest rates are already making their presence felt in the real economy. And as this continues, volatility should rise, and that’s bullish for the U.S. dollar and bearish for the PMs….
Taking note, the crude oil price has pulled back in recent days, as traders realize that higher long-term interest rates suppress, not enhance, economic activity. And as long-term rates weigh on the real economy, there is a greater chance of an ‘uh oh’ event occurring.
Thus, while we faded the recession talk when it was all about the FFR, higher long-term interest rates are a different animal. In reality, they cause recessions due to their impact on consumers’ borrowing costs and disposable income. Consequently, the data is an ominous sign for the medium-term health of the U.S. economy and the PMs.
Please see below:

To explain, weak PMI data (the blue line) is often associated with negative YoY GDP growth (the gray bars). Thus, with the blue line suffering a material drop on the right side of the chart, continued weakness spells trouble for economic growth.
Even more important, the U.S. service sector accounts for more than 70% of U.S. GDP. And while manufacturing has been in a recession for some time (PMI < 50), services have more than picked up the slack. But, with S&P Global’s Services PMI suffering mightily too, the results are even more concerning than usual.
Please see below:

So, these developments are bearish for the S&P 500 and the PMs over the medium term, and volatility should rise in the back half of 2023. Remember, when the extent of the economic damage becomes obvious, a recession follows, volatility strikes, and the USD Index often soars as liquidations unfold across risk assets.
Overall, we booked profits on the short and long side, as we know that bear market rallies are part of the journey to any asset’s final low. And with the GDXJ ETF reversing once again, we re-entered our short position at a higher price. As such, the technicals proved prescient once again.
Do you think the U.S. will enter a recession over the next six months?
Silver Is Still Overvalued
After converting our GDXJ ETF long position back into a short position near the highs, the price action on Aug. 24 further increased our profits. Moreover, with gold falling slightly and silver suffering, the PMs’ downtrends resumed, as expected.
In addition, please note that it wasn’t only the U.S. that showed economic weakness. In fact, the data out of Europe was even worse. For example, S&P Global reported that its Eurozone Composite PMI sunk to a 33-month low on Aug. 23. An excerpt read:
“Eurozone business activity contracted at an accelerating pace in August as the region’s downturn spread further from manufacturing to services. Both sectors reported falling output and new orders, albeit with the goods-producing sector registering by far the sharper rates of decline. Hiring came close to stalling as companies grew more reluctant to expand capacity in the face of deteriorating demand and gloomier prospects for the year ahead, the latter sliding to the lowest seen so far this year.”
The report added:
“Looking at growth across the euro area, the steepest downturn was recorded in Germany, where output across both goods and services fell for a second month and at a rate not seen since May 2020 (and since June 2009 if the pandemic is excluded).”
For context, Germany is Europe’s largest economy, and these developments should have severe consequences over the next three to nine months.
Please see below:

As a reminder, assets like silver and the GDXJ ETF suffer mightily when volatility strikes. And with economic data outperforming recently, the next move lower should create a crisis of confidence among the bulls.
Please see below:

To explain, the blue line above tracks Citigroup’s U.S. Economic Surprise Index (ESI). For context, a surprise occurs when a data point outperforms economists’ consensus expectations. And with the metric peaking near 85, the recent run of hot data is on par with the highs seen over the last ~20 years.
However, if you analyze the movement of the blue line after reaching these heights, you can see that sharp drops often followed, and readings near -80 can materialize. As a side note, the metric was much more volatile during the pandemic, as base effects played a key role. As a result, -80 to +80 is a more appropriate range.
The moral of the story is that while Europe looks poised for an abrupt recession, the U.S. may not be far behind. When interest rates were too low, they helped the ESI soar as relatively cheap money made borrowing more affordable. However, the recent rate surge means those days are over, and major volatility should be on the horizon.
Volatility Season
With the USD Index poised for more upside, the greenback is often a big winner when recessions arrive. And with Cboe Volatility Index (VIX) seasonality highly bullish, more financial market chaos is bearish for the PMs.
Please see below:

To explain, the VIX has risen recently, which aligns with its seasonal trend. And if you analyze the red circle on the right side of the chart, you can see that it often peaks in early October. Consequently, we’re not even halfway through the VIX’s typical seasonal surge, and if history repeats, it’s profoundly bearish for the S&P 500 and silver.
Speaking of which, the S&P 500 and silver hit their 2022 lows alongside one another, and the price action culminated with a spike in the VIX. And if (when) another rendition occurs in the months ahead, the development should enhance the profits from our GDXJ ETF short position.
Please see below:

To explain, the gray line above tracks the silver futures price, while the black line above tracks the inverted (down means up) VIX. As you can see, silver has largely moved in the opposite direction of volatility for more than 12 months. Thus, if harsh economic realities push the VIX north of 30 – which occurred plenty of times in 2022 – silver could slide south of $20.
To that point, while oil bounced on Aug. 24, its recent pullback highlights how the PMIs’ plight is bearish for risk assets, and history also supports this conclusion. In other words, while volatility has begun to increase, we think a further uprising could cause several overvalued assets to suffer sharp corrections in the months ahead.
Overall, we booked gains on our GDXJ ETF short and long positions and have re-entered the short at a more attractive price. And since we expect selloffs to confront gold, silver and mining stocks over the medium term, the profit potential is immense. So, while we remain long-term bulls, many of our indicators are still flashing red, which means caution is warranted as we approach the fall months.
Do you think the VIX will surpass 30 before the end of 2023?
The Bottom Line
A hawkish blizzard has pounded the PMs throughout August, and after a short respite, we believe the freeze will continue. With U.S., European and U.K. PMIs all missing expectations, suddenly, the economic invincibility narrative has started to show cracks.
Furthermore, we warned this would occur, as higher long-term interest rates are much more damaging than a higher FFR. The reason is consumers don’t borrow at the FFR; they take out auto loans and mortgages with 5-30-year maturities. Consequently, the fundamentals continue to unfold as expected, and little has changed to alter our short or medium-term thesis.
In conclusion, the PMs declined on Aug. 24, as Treasury yields, and the USD Index headed higher. We expect more of the same, as the PMs’ corrections are likely far from over.
Alex Demolitor
Precious Metals Strategist