


[GoldenMeadow.eu and GoldPriceForecast.com EXCLUSIVE – a fragment of today’s Gold Trading Alert]
In yesterday's Gold Trading Alert, I wrote the following about crude oil:
"Additionally, please note that crude oil has been rallying almost without a single break for three weeks now and it just encountered a strong resistance area. It's based on the 50% and 61.8% Fibonacci retracements, the June highs, and the declining resistance line. We saw a small breakout above the latter, but given this volatility it could be invalidated any minute.
Yes, the fundamental situation fully supports the rally, but still… Corrections happen anyway."
Today that breakout was invalidated. Crude oil futures opened at $92.50, reached $92.81, and fell back under $90.
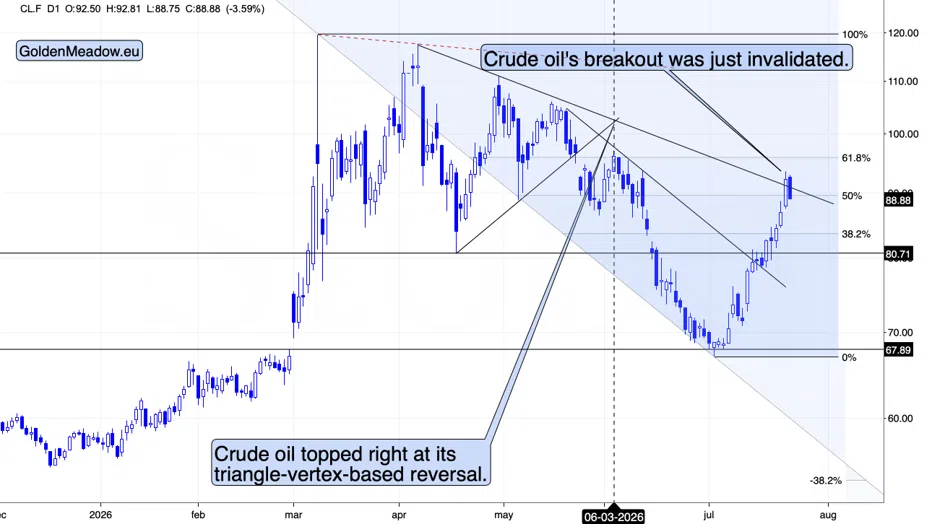
Here is what makes that worth more than a day's satisfaction. The news did not improve overnight. It got worse. Iran rejected a ceasefire proposal delivered by the Iraqi prime minister. American forces carried out a twelfth consecutive night of strikes. Trump warned of expanded military action against Iran, told Axios he was considering a massive attack and was close to a decision, and said Israel would join in two minutes if he asked. Iranian drones struck northern Kuwait. Brent traded above $100 for the first time since May, after settling at $71.57 on the first of July, a rise of about 40% in three weeks.
Every one of those is a reason for crude to go higher. Crude went lower because it arrived at a price where sellers were waiting. The fundamental picture was fully supportive and the market corrected anyway. This is the point I keep coming back to, and today made it about as plainly as it can be made: the news tells you why people say a market moved, and the chart tells you where it stops.
The metals turned up on it, with silver leading. That is the same chain running backwards for a session. Less oil means less inflation pressure, which means less reason to expect the Federal Reserve to tighten, which lets the metals breathe. It is the final stretch of the corrective upswing I described earlier this week, and it is arriving on cue.
Now look underneath it, because the week has done something to the rate picture that deserves your full attention.
Nine days ago the June inflation reports landed soft. Consumer prices fell on the month, core came in flat, producer prices missed to the downside, and the market decided the Federal Reserve was finished. The odds of a hike at this month's meeting fell to roughly one in ten. September sat near a coin flip. That repricing is what gave gold its bounce off the lows, and I wrote at the time that the print described a June the July oil spike was already erasing.
Look where those odds stand today. The market now prices about a one-in-three chance of a hike at next week's meeting, and above 78% by September. The entire dovish case was built and demolished inside nine days, and the thing that demolished it was the oil price.
Set that against what gold has to show for the week. A modest weekly gain. The rate backdrop turned sharply against it, the war escalated on two fronts, oil ran 40% in three weeks, and gold ends the week slightly higher after a bounce off nine-month lows. That is not a market drawing strength from events. That is a market working off an oversold condition while the case against it gets rebuilt from the ground up.
Meanwhile, gold and silver seem to have verified their short-term breakouts.
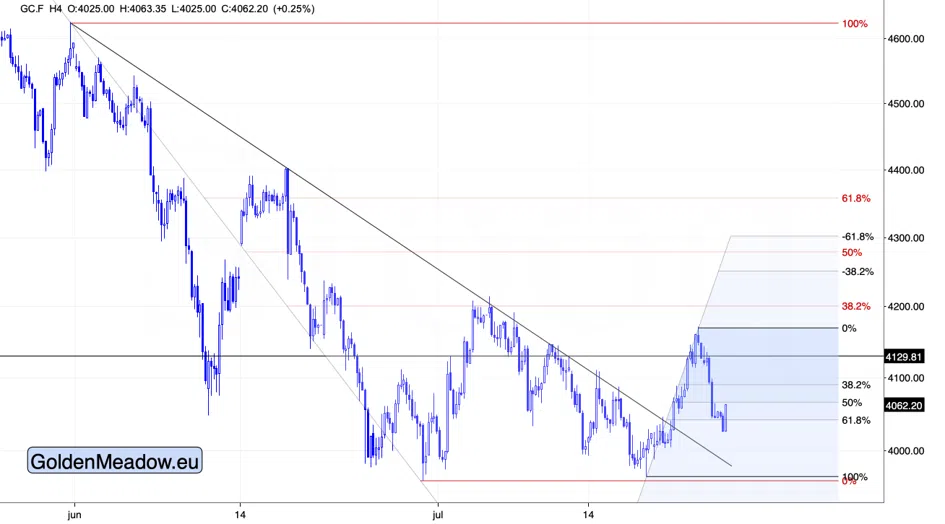
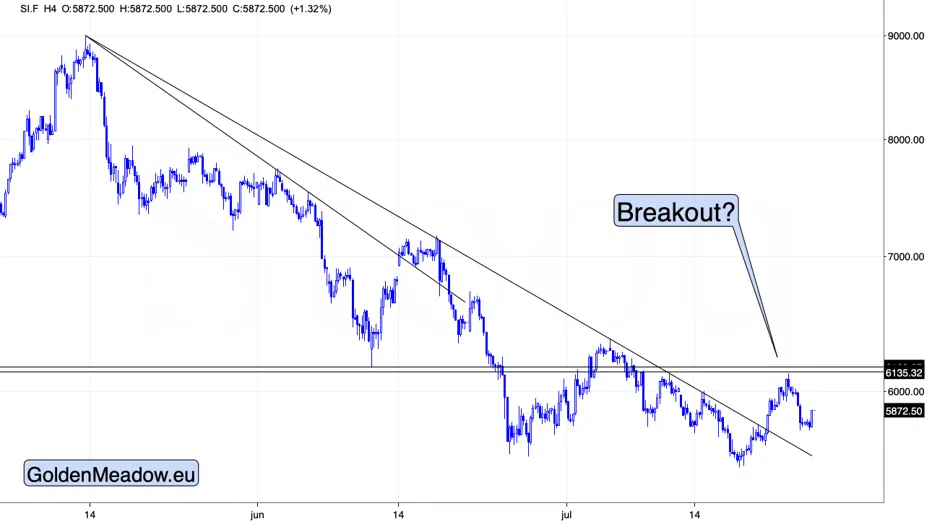
The breakouts were followed by quick (yesterday’s session) declines, and now they appear to be moving back up. This is the initial reaction to crude oil’s invalidation of its breakout. As oil’s invalidation is likely to lead to bigger declines at least in the very short term, I think that expecting very short-term gains in the precious metals sector makes sense, especially given the situation in the USD Index.
Interestingly, there’s also a nearby triangle-vertex-based reversal point in the S&P 500 Index futures.
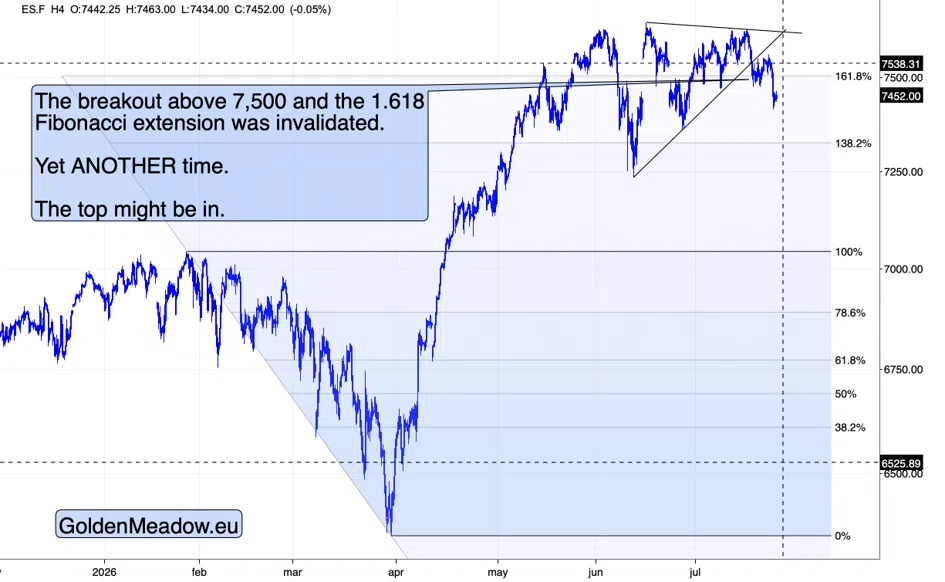
Perhaps it’s the final rebound before the slide?
A single technique is not enough to determine that but…
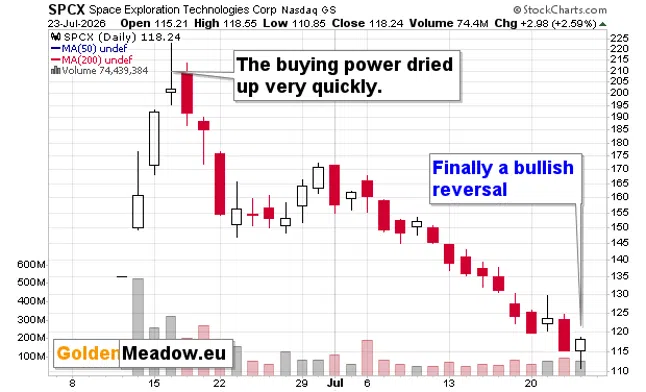
SpaceX finally formed a bullish reversal yesterday. This company was supposed to be a hit, and the market apparently added an ‘s’ to the front. A few days of excitement-based gains were followed by reality kicking in when people slowly realized that the financials don’t live up to the hype.
And yet, we saw a bullish signal yesterday. When laggards lead, the broader market is likely topping, and while it’s not taking place yet, yesterday’s reversal indicates that this is what might happen next.
The confusing part about all this is the timing. Based on how long the counter-trend rallies lasted in the GDXJ, it’s likely to end today or perhaps on Monday.
The triangle-vertex-based reversals in USDX and stocks seem to confirm that.
SpaceX signal would likely result in a rally that lasts longer – days or maybe even a week or two. That’s how long those laggard-vs-leader rallies tend to last given this scale of the decline.
Crude oil’s decline could also last several days and maybe up to 1-2 weeks. Sure, crude oil pulled back sharply in March, and the decline lasted only two days, but it was after a rally that was similarly sharp. The recent rally was more measured, so the same is likely to be the case for the corrective decline. The recent pace of growth is similar to what we saw in late March and late April. The initial declines that followed lasted 4-8 days, and today is the first day of the decline (most likely - we don’t have today’s closing price yet).
Overall, I’m leaning toward the scenario in which the corrective upswing in the precious metals market extends into the following week.
The thing that tipped the scales in case of my expectations is self-reflection. I’ve moved back to the bearish camp too early more often than too late, and it’s worth taking that into account here as well.
I’m cautiously watching the market with the finger on the trigger, but as of this moment, I no longer think that the short positions should be re-entered today. I can change my mind based on what we see later today, and in this case I’ll let my subscribers know via intraday Alerts, but this is where I stand right now.
[The analysis continues, and it includes my detailed and updated take on the near- and medium-term targets for gold, silver, and mining stocks. We currently have a very special offer for new subscribers and I encourage you to check it out.]
Thank you for reading my today’s free, Gold-Trading-Alert-based analysis.
Sincerely,
Przemyslaw K. Radomski, CFA