From one extreme to the other, will too many bulls weigh down the price of gold?
With risk assets suffering further declines on Nov. 21, the uninformed optimism is slowly starting to dissipate. Moreover, with overly bearish positioning as the main driver of the recent recalibration, the ominous fundamentals make it difficult for the bulls to muster more upside catalysts. To explain, I wrote on Nov. 16:
While the new narrative assumes that inflation is dead, bonds are a buy, and liquidity-fueled assets like tech stocks and the PMs are poised for new highs, the sentiment shift is bullish for our GDXJ ETF short position.
In a nutshell: when too many investors see things from our perspective, positioning gets crowded, and the unwinding of bearish bets uplifts the metals. Conversely, when our thesis becomes contrarian once again, the PMs need sustainable fundamental and technical reasons to move higher, which we believe they lack.
So, while the GDXJ ETF’s recent rally has not been fun, the fundamentals never changed, only sentiment did; and with that same sentiment now dangerously over-bullish, positioning supports another leg lower for gold, silver, and mining stocks.
Thus, while the junior miners and the gold price have declined since then, positioning is no longer helping the bulls; and though S&P 500 seasonality supports higher prices, the sentiment shift is positive for our GDXJ ETF short position.
To that point, the USD Index recorded a material rally on Nov. 21, and with the crowd turning bearish on the dollar basket, the herd behavior should provide fuel for the next upswing.
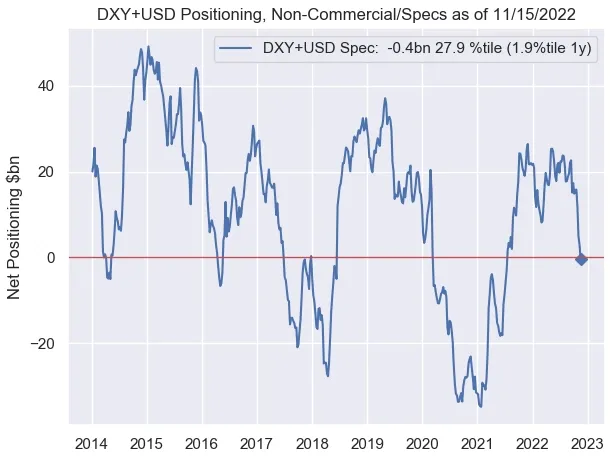
For example, non-commercial (speculative) futures traders are net short the U.S. dollar for the first time since mid-2021.
Please see below:
 Source: Nomura
To explain, the blue line above tracks speculative U.S. dollar net futures positioning, while the horizontal red line represents the neutral level. If you analyze the right side of the chart, you can see that speculators have dumped the dollar, though not present on the chart, feverously bought the euro.
However, the misguided shift is bullish for the USD Index because positioning is no longer stretched, and a reversal of these moves should drive the dollar higher over the medium term.
As further evidence, asset managers also ramped up their bets against the U.S. dollar.
Please see below:
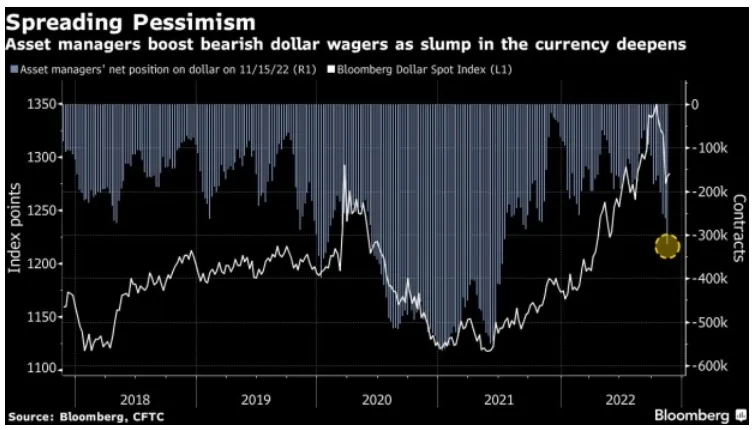
To explain, the white line above tracks the Bloomberg Dollar Spot Index, while the blue bars above track asset managers’ net short positions. If you analyze the right side of the chart, you can see that bearish bets have intensified, and the crowd is loving the pivot narrative.
The Bloomberg article stated:
“Investors boosted short positions on the reserve currency to 321,758 contracts last week, the most since July 2021, according to data from the Commodity Futures Trading Commission on eight currency pairs compiled by Bloomberg. Hedge funds are similarly bearish: they sold the greenback for a fifth straight week (…).”
“Asset managers boosted bullish wagers on the euro while cutting net shorts on the yen and pound, underscoring the shift in sentiment toward the U.S. currency.”
Yet, notice how the USD Index enjoyed a sharp daily rally soon after the crowd turned bearish? Remember, joining the consensus is suboptimal because sharp reversals can occur when sentiment shifts. However, with the consensus dumping the dollar, the positioning is where we want it to be, and a stronger USD Index should materialize in the months ahead.
Also, remember how bearish positioning helped ignite the S&P 500's short squeeze? Well, that imbalance has also reversed. I added on Nov. 16:
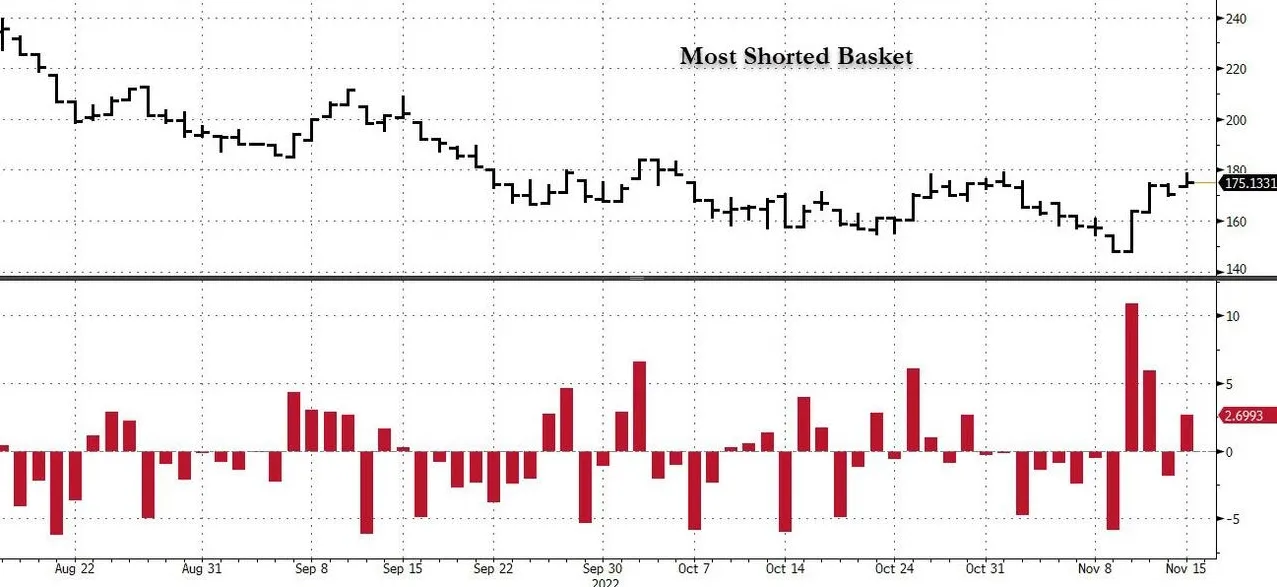
The sector performance highlights why the PMs’ squeeze has likely run its course, as all of these assets will need fresh buyers to support higher prices. As evidence, Goldman Sachs’ basket of the most-shorted stocks is up by ~18% over the last four days.
Please see below:
 Source: Bloomberg/ZeroHedge
To explain, the black line at the top half of the chart tracks the performance of Goldman Sachs’ most-shorted basket, while the red bars at the bottom half add visual clarity. If you analyze the right side of the chart, you can see that the red bars rose materially, which means the stock market’s short-covering surge is much less bullish than it seems.
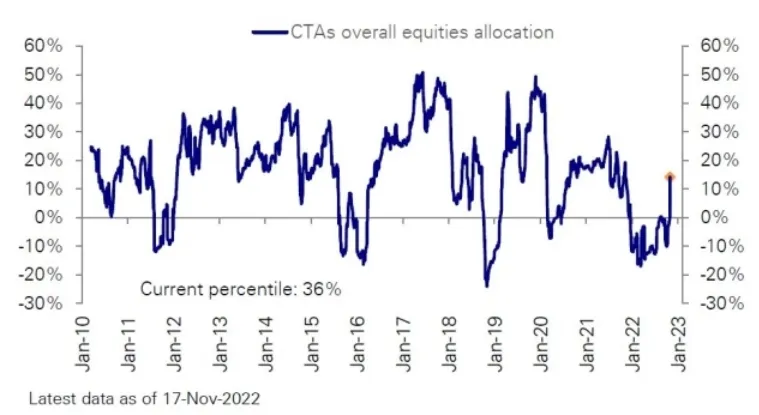
In addition, while Commodity Trading Advisors (CTAs) flipped from net short to net long, the algorithms are also struggling to find bullish catalysts to increase their exposure further.
Please see below:
 Source: Deutsche Bank
To explain, the blue line above tracks CTAs' equity positioning. If you analyze the right side of the chart, you can see that algorithmic exposure increased from roughly -10% to north of 10% in recent weeks.
The Bloomberg article stated:
CTAs “had to buy an estimated $146 billion of stocks in the past month amid a Consumer Price Index (CPI)-reading fueled rally, the largest buying spree since March 2020, according to an estimate from Scott Rubner, a Goldman Sachs Group Inc. managing director (…). Quants were caught off guard following the latest cooler-than-expected CPI print as it sparked a cross-asset rally and a stock-buying spree.”
However, please remember that these funds often increase and decrease their exposure based on volatility; and with the Cboe Volatility Index (VIX) near the low end of its 2022 range, don’t be surprised if volatility intensifies and CTAs rush for the exits.
Please see below:
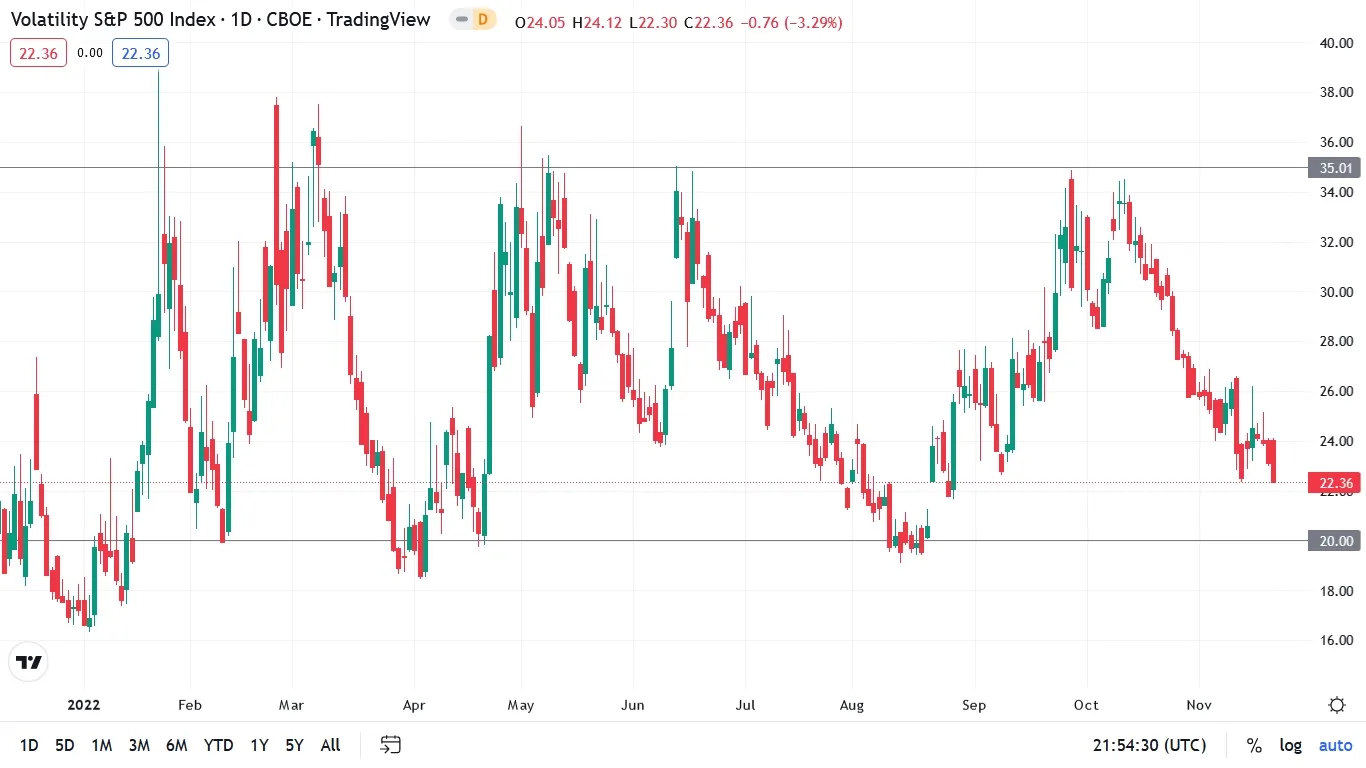
To explain, the candlesticks above track the Cboe Volatility Index (VIX). For context, it measures the S&P 500’s expected volatility over the next 30 days. If you analyze the horizontal gray lines, you can see that the VIX has formed a rough channel between 20 and 35 in 2022; and with the metric ending the Nov. 21 session at ~22, the seasonality bulls are happy to suppress volatility despite the bearish fundamentals.
However, with the VIX poised for another sharp uprising, the GDXJ ETF and the S&P 500 confront an opposite positioning backdrop compared to mid-October. Moreover, with the gold price also suffering four straight daily declines, sentiment is the only thing keeping risk assets elevated.
Yet, with the law of gravity implying that ‘what goes up must come down,’ the bear-to-bull positioning shift should elicit substantial drawdowns when the next bout of volatility erupts. I wrote on Nov. 15:
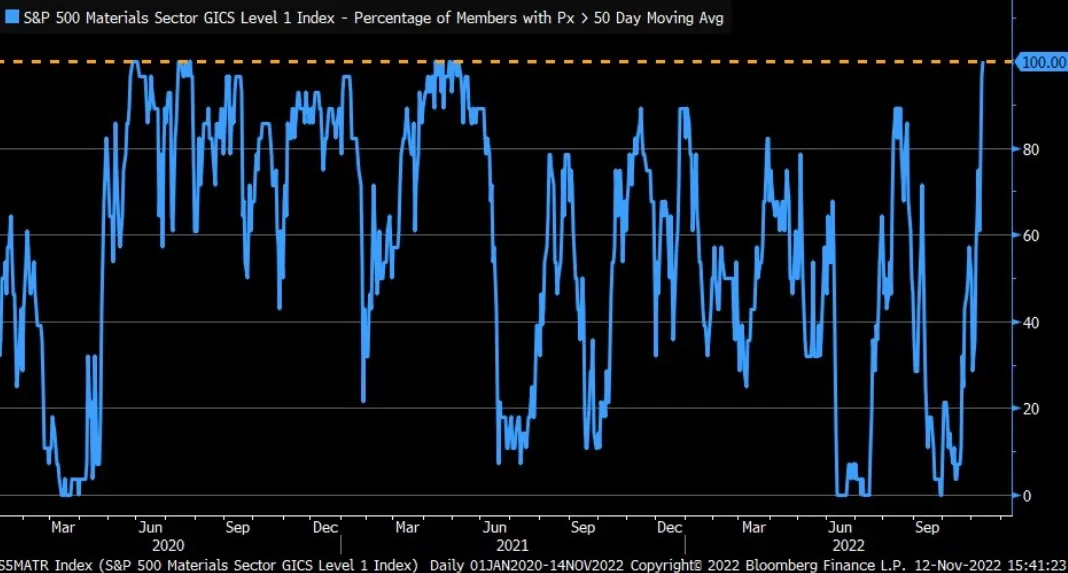
The blue line above tracks the percentage of companies in the materials sector trading above their 50-day moving average. For context, metals and mining make up roughly 14% of the sector. If you analyze the right side of the chart, you can see that the figure stands at 100%, which is a sizable shift from the 0% present in late September.
As a result, the data highlights why we’re likely much closer to the top than the bottom; and notice how abnormally high and low readings are nearly impossible to sustain? This is because periods of too much pessimism and optimism often revert to the average when investors take a thoughtful look at the fundamentals.
Therefore, since the metric can’t go any higher, a material reversal should result in substantial declines for gold, silver, and mining stocks over the medium term.
The Daly Brief
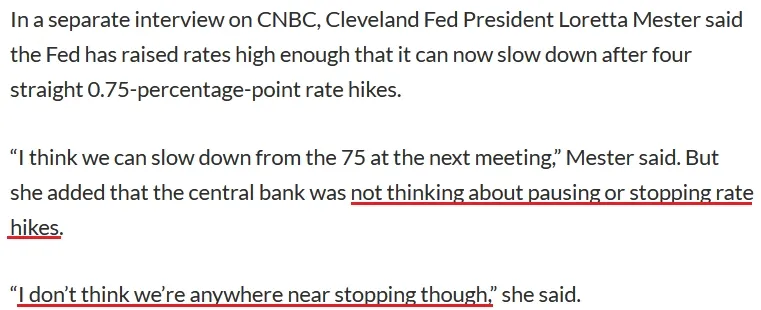
With Fed officials reiterating their commitment to curbing inflation, rate hike expectations have recovered nearly all of their CPI-induced losses; and with San Francisco Fed President Mary Daly joining the fray on Nov. 21, she said:
“As we work to bring policy to a sufficiently restrictive stance – the level required to bring inflation down and restore price stability – we will need to be mindful. Adjusting too little will leave inflation too high. Adjusting too much could lead to an unnecessarily painful downturn.”
She added:
“I really want to make sure the job is well and fully done. Inflation is a regressive tax. It injures most the people least able to bear it. Ending early in hope that it will go away and we’ve done enough is not at all satisfying to me.”
So, while the pivot crowd continues to buy hope and sell reality, the U.S. federal funds rate (FFR) still has plenty of room to run.
Please see below:
 Source: Bloomberg
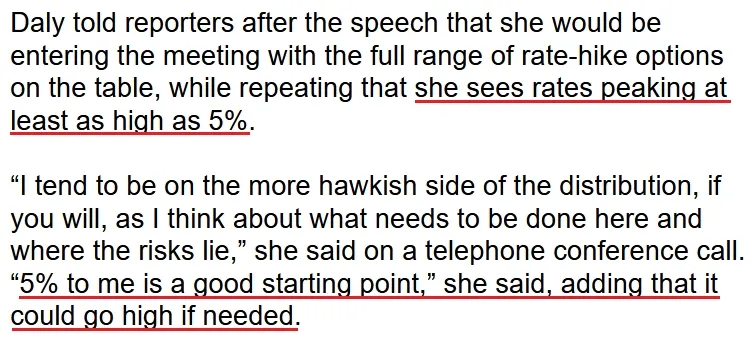
Also noteworthy, Cleveland Fed President Loretta Mester sang a similar tune on Nov. 21. She said:
“I don’t think we should underestimate the consequences of continued inflation in the long run for the health of the economy.”
Moreover, while she noted that it’s appropriate to slow down the “pace of increases” in the months ahead, she made it clear that a higher FFR is on the horizon.
 Source: MarketWatch
The Bottom Line
With reality slowly returning to the financial markets, the S&P 500 has suffered, while the gold price has also been on the defensive. However, with the dip buyers still showing up intraday, the seasonality bulls are hoping for a Santa Clause rally. But with Fed officials destroying the pivot narrative and the fundamentals profoundly bearish, the PMs should confront lower lows in the months ahead.
In conclusion, the PMs declined on Nov. 21, as the USD Index regained its swagger; and while the U.S. 10-Year real yield declined, it’s still north of 1.5%. Thus, while sentiment is relatively optimistic, bullish positioning is stretched, and we believe that shorting the GDXJ ETF remains attractive from a risk-reward perspective.
Alex Demolitor
Precious Metals Strategist