Pretty much nothing changed on the long-term front since I posted last week’s flagship analysis.
So this Friday, I will focus on one specific long-term link and I’ll show you a chart featuring one stock that I haven’t commented on in a while but that provides invaluable confirmation at this time.
Let’s start with the former.

The entire 2020 – now period is a prolonged hybrid of what we saw in 2008 and what we saw between 2011 and 2013, but since I’ve been describing this for weeks (also last week), today I’d like to focus on something different.
Gold once again tried to move above $2,000 recently , just as it did a few other times in the previous years.
The first of the recent attempts took place in mid-2020, the second was in early 2022, the third was in early 2023, and we just saw another attempt this week.
Now, let’s take a look at the HUI Index and see what gold stocks did on those occasions – where did they top in each of those cases?
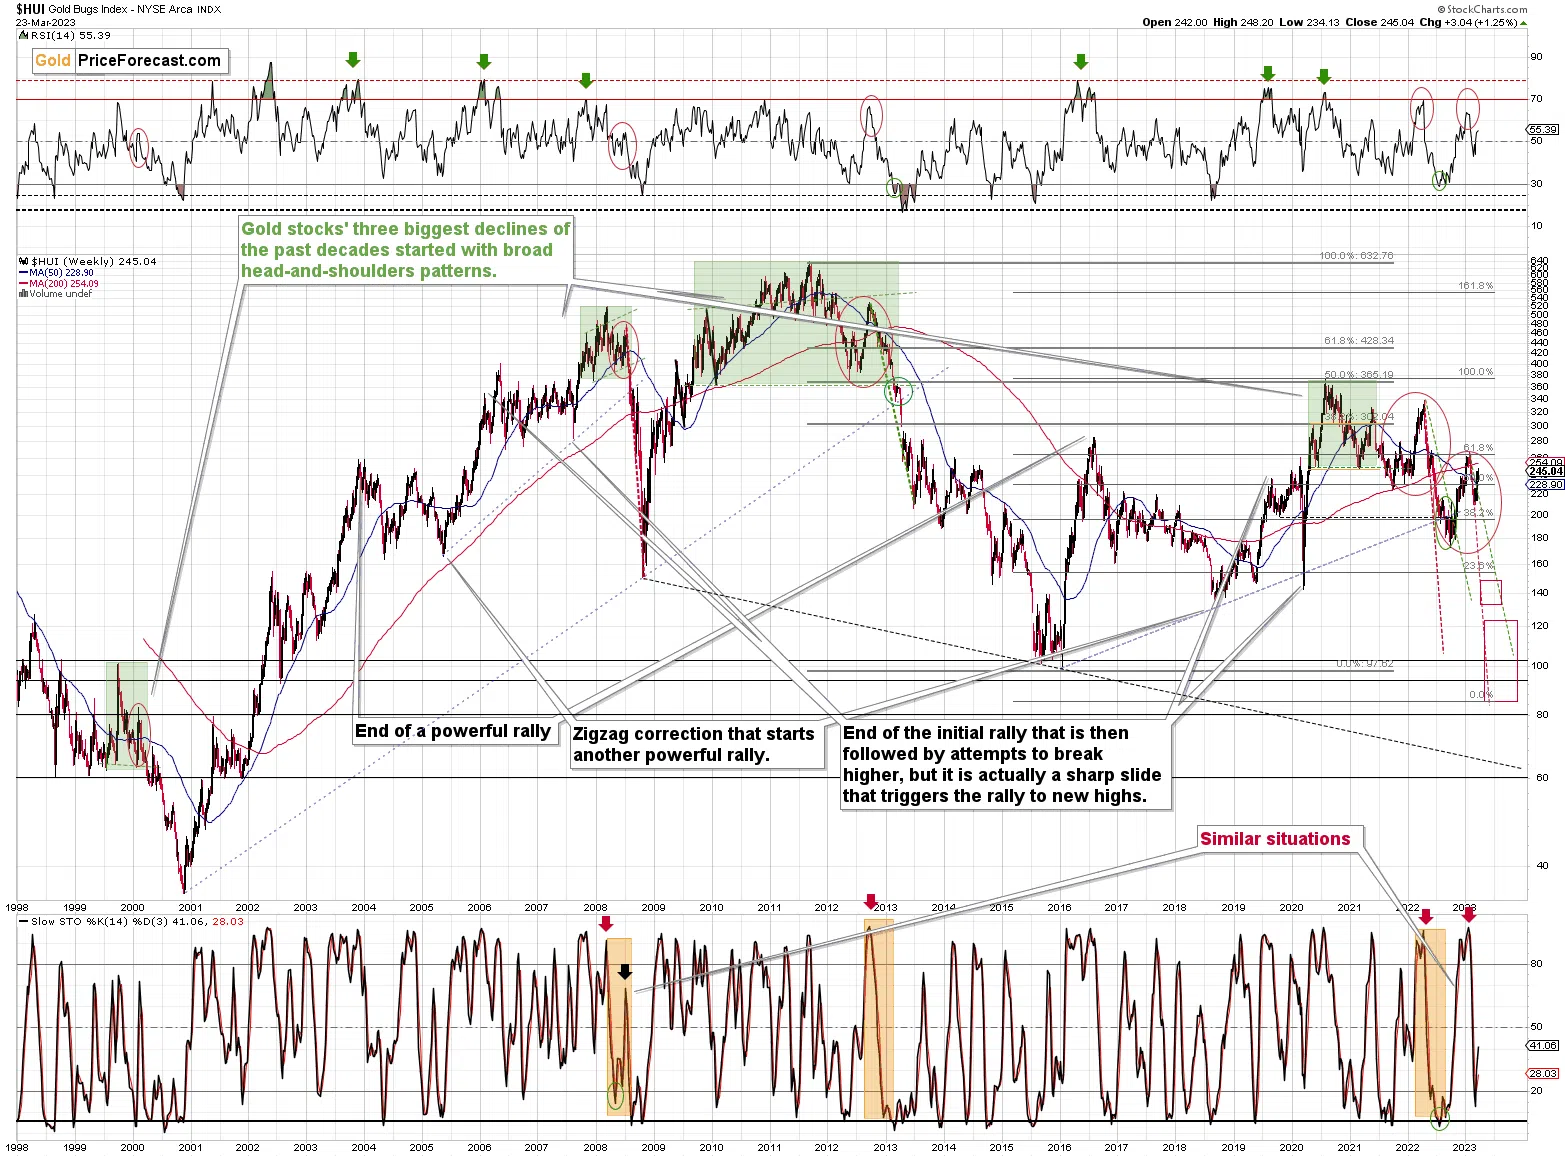
In mid-2020, the HUI Index topped just a little below 380.
In early 2022, the HUI Index topped just a little below 340.
In early 2023, the HUI Index topped a bit above 260.
And right now, the HUI Index seems to have topped below 250.
Gold stocks continue to show medium-term weakness relative to gold. This is very similar to what we saw in 2012 and early 2013, and it has profoundly bearish indications for the following months and weeks.
As far as the USD Index’s long-term picture is concerned, what I wrote yesterday remains fully up-to-date:
As far as the USD Index is concerned, the long-term chart continues to point to a similarity with what happened in 2008.

If you look at what happened in mid-2008 – before the near-vertical rally – you’ll see that the back-and-forth movement at the bottom was normal. There was not a single bottom, but a few of them. So, seeing a quick decline here doesn’t make the current picture bullish.
In fact, if you look at the RSI indicator, you’ll see that the final small decline that led to the final bottom started with RSI at about 50.
That’s exactly the level that was just hit, before USD’s recent short-term decline.
And when did that final short-term decline end in 2008? Above the previous lows, when RSI moved to… The levels that it’s at right now.
Yes, the situation is bullish for the USDX, even though it doesn’t seem like it based on what’s going on in the world. The sentiment was very similar back in 2008, and we all know what happened next.
The thing that I would like to add today is that the USDX moved slightly higher yesterday, and it’s moving more visibly higher in today’s pre-market trading.
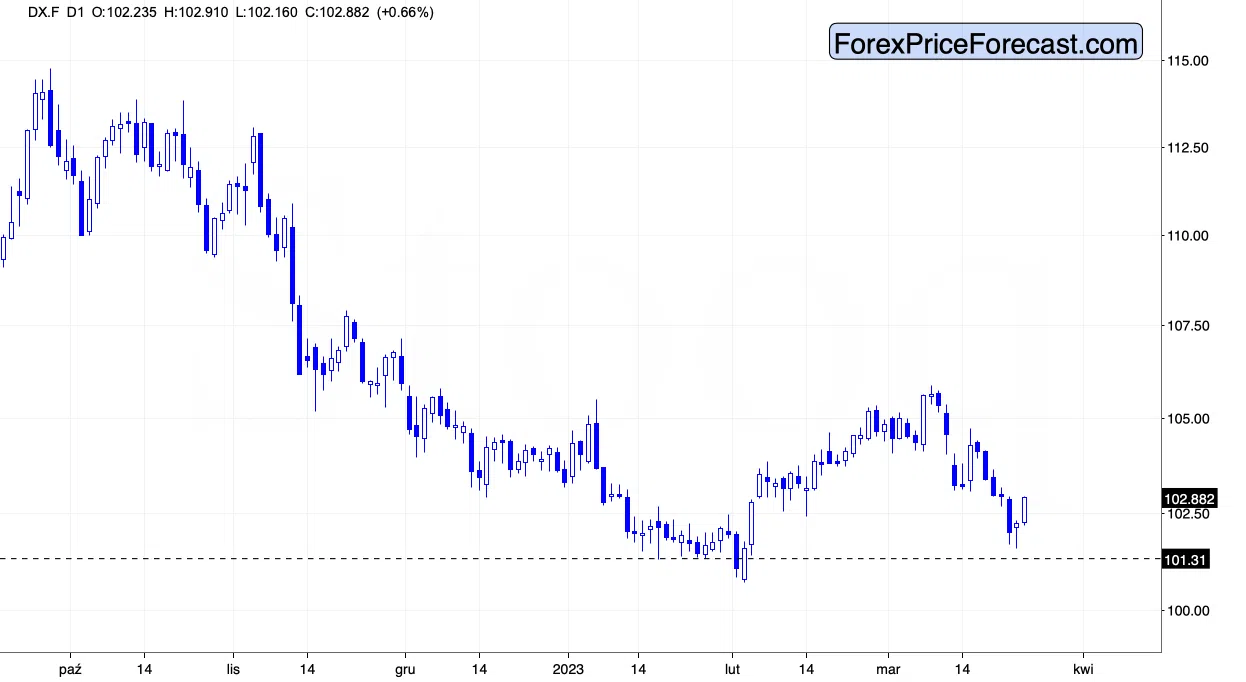
Was that the bottom? Based on the above short-term chart, it’s just possible, but based on the precious long-term chart, it’s quite likely. And even if not, it seems that the bottom is at hand, and the huge rally is likely just around the corner.
The situation on the general stock market also continues to develop in tune with my previous expectations. While the key technical development of extreme importance is visible in the long-term chart featuring world stocks (see last week’s analysis for details), today I’ll focus on the short-term confirmations. And we got those from the S&P 500 index.

Quoting my yesterday’s analysis:
Please take a look at the RSI – it just jumped above 50 for the second time after the major top. The same thing happened in September 2022. And what happened next? Stocks plunged!
So, if the history is similar to a smaller extent to 2008 and to a bigger extent to 2022, stocks might slide right away, or very soon.
When that happens, miners – and especially junior miners – would be likely to follow.
This means that we might (as I wrote above) or might not have a measured decline in juniors, and we might have a more volatile drop soon.
Which one will it be? I’m not sure, and I don’t care that much, because the position that we have is likely to become extremely profitable (in my view) in the following weeks, regardless of which of the above scenarios plays out.
The S&P 500 ended yesterday’s session a bit higher, but the most important thing is that it tried to move much higher and reversed its course. The S&P 500 futures are also down in today’s pre-market trading. Consequently, it seems that the next big move lower is already underway.
The implications for junior mining stocks are particularly bearish.
Thank you for reading our free analysis today. Please note that the above is just a small fraction of the full analyses that our subscribers enjoy on a regular basis. They include multiple premium details such as the interim targets for gold and mining stocks that could be reached in the next few weeks. We invite you to subscribe now and read today’s issue right away.
Sincerely,
Przemyslaw K. Radomski, CFA
Founder, Editor-in-chief