Yesterday’s session was extremely generous in providing us with clues as to what price action is real, what is fake, and what is to be expected.
In my analysis yesterday, I wrote that the immediate-term price movements might be chaotic, especially in gold and forex. That’s where we saw the greatest turbulence. To be precise, we also saw significant daily volatility in silver and fresh lows in the FCX, so the profits in the short position in that particular instrument have increased yet again.
Just a quick update on the latter before I move on to the main part of today’s analysis.
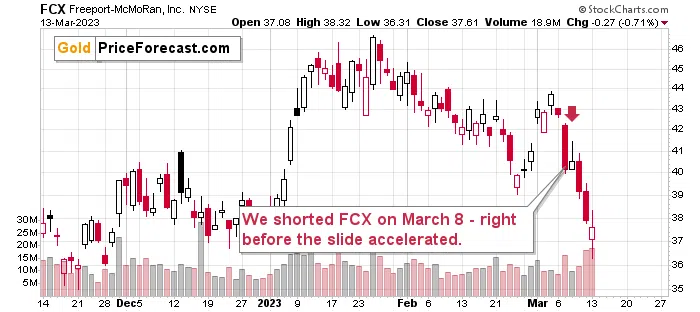
We shorted the FCX on March 8, which provided a great entry point as the stock moved higher during the first part of the day, so we shorted into strength – it was easy to open the position.
Now that yesterday’s session is over, we had a (hopefully) good night’s sleep (if you didn’t, it might serve as an indication that the sizes of your positions are too big…), and (since none of us controls the market prices) we can do the only thing that depends on us in the case of investing and trading: analyze the situation as objectively as possible.
Let’s start with the general stock market.

After big intraday volatility, the S&P 500 ended the day slightly lower. This is not really important by itself, but it is important in the context of the head-and-shoulders formation that stocks have just completed. By moving higher and then ultimately closing slightly lower, the breakdown below the neck level of the formation was confirmed.
This means that the short-term outlook for stocks became even more bearish, and the odds are that this is indeed the first part of a massive, medium-term move lower. The technical link to 2008 that I described in my previous flagship Gold Trading Alert as well as the fundamental notes that I made yesterday all point to lower stock market values in the following weeks and months.
This has bearish implications for the precious metals sector, as it’s been moving in tune with stocks for almost a year now. In particular, silver and mining stocks (especially junior mining stocks) are likely to be impacted by lower stock market values.
Before we look at the USD Index, please consider the lower part of the above chart that features gold, silver, and gold stocks (brown color). Please note that while gold and silver moved visibly higher, the price action in gold stocks is barely noticeable from this point of view. Timing is one thing, but sector selection is another way, in which I’m creating value for my subscribers.

Do you remember how I recently described the likelihood of seeing a rebound (the one on which we profited) based, i.e., on the similarity to mid-2021 in the USD Index?
It seems that this similarity continues to some extent, but this time it appears to be taking place at a faster pace.
I marked the current similarity with green rectangles.
After the initial rally, the USDX corrected to its (blue) 50-day moving average (approximately). During this move lower, the RSI moved below the 50 level after an initial rebound. In response to the above, gold moved higher – above the previous high.
Back in mid-2021, the move higher in gold was not significant compared to the size of the initial rally. This time, the initial rally was smaller, and the second upswing was bigger. That’s fine – the history was never supposed to repeat itself to the letter, but it was likely to rhyme. And indeed, it just rhymed.
What happened next? The USD Index resumed its uptrend, gold plunged, and the decline in gold was disproportionately big compared to the rally in the USDX. This analogy, therefore, has very bearish implications for gold going forward.
That’s not the only bearish thing that happened on gold’s technical front.

Gold also moved on huge volume, and the last time it rallied on such volume was at its 2022 top.
Also, I’ve been writing about the similarity between now and what happened in the middle of the previous year, but it seems that the analogy should be adjusted. The early 2023 top seems to be similar to the early 2022 top, and what we see now is actually similar to what we saw in mid-April 2022.
In fact, if you consider that gold formed a double bottom in March 2022 and also in February and March 2023, the link becomes even clearer.
Now, how high did gold rally back in April before launching a powerful, almost $400 slide? It rallied (almost) to its 61.8% Fibonacci retracement level.
How high did gold move yesterday? Slightly above its 61.8% Fibonacci retracement level. At the moment of writing these words, gold futures are trading at about $1,906, which means that they have already moved back below the 61.8% Fib. retracement, thus making the situation even more similar to what we saw last year.
If the analogy were to continue, what would be the next step for gold? A decline – a powerful one.
One might say that a single, huge-volume session is not that important, just as one swallow doesn’t make a summer. That would be nicely said, but…
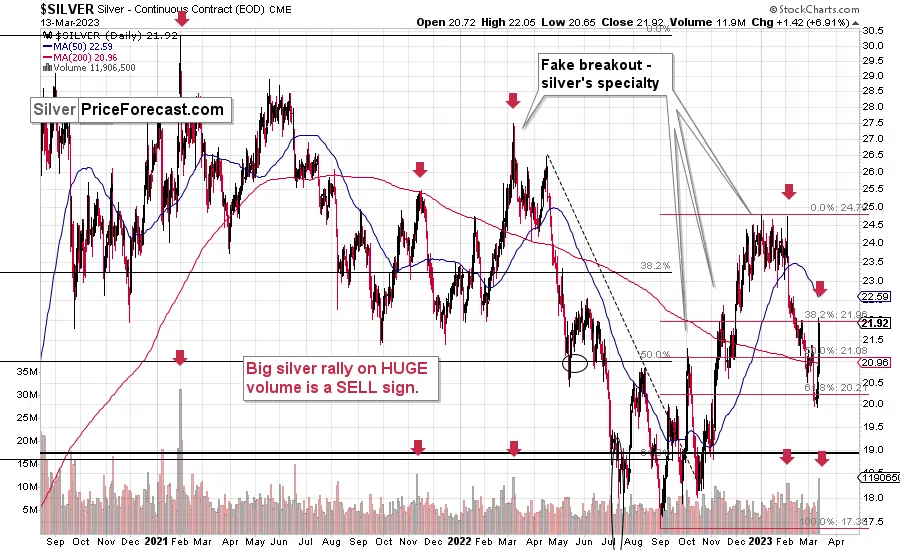
Silver provides an extremely clear indication of just how important yesterday’s volume was.
In practically all cases, when silver moved higher on volume that was similarly big (there were four such cases), it marked a major top. This includes the 2021 top (slightly above $30) and the 2022 top. It also includes this year’s top that we saw in early February.
It’s not particularly complicated, nor is it perplexing. The difficulty in applying this knowledge in practice is the ability not to follow the herd, despite it being difficult on an emotional level.
The remedy is simple: take at least a small break from the market’s emotionality, stop checking prices for at least a while and do something that relaxes you. Take a walk, talk to your loved ones (but not about the markets ;) ), meditate (perhaps with ceremonial-grade cacao, which is my personal favorite), or do whatever you know works best for you.
Then, once you have grounded yourself and can look at everything – including markets – with a calm mind, look at what the chart is really saying.
In my opinion, based on what we see on the above chart, the silver price is saying “don’t let this fool you, I’m about to decline after showing strength, just like it’s happened many times before – the cycle is almost complete, you still have time to react, but not much thereof”.
Thank you for reading our free analysis today. Please note that the above is just a small fraction of the full analyses that our subscribers enjoy on a regular basis. They include multiple premium details such as the interim targets for gold and mining stocks that could be reached in the next few weeks. We invite you to subscribe now and read today’s issue right away.
Sincerely,
Przemyslaw K. Radomski, CFA
Founder, Editor-in-chief