Gold and silver are not doing much today, but the action in the USD Index is once again critical.
Here’s what’s happening from the daily point of view:
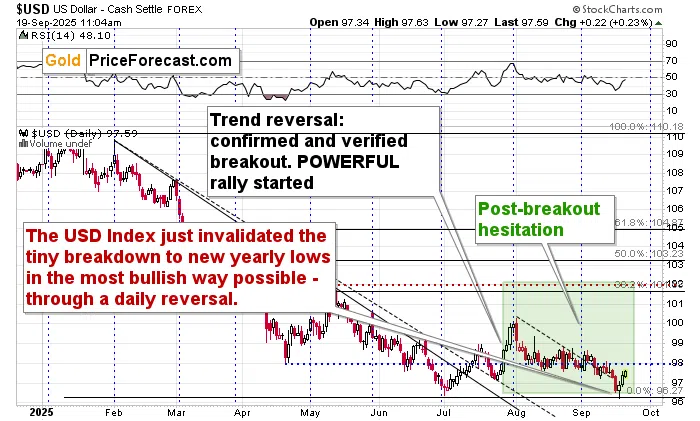
The USD Index is clearly up after invalidating the small breakdown to new yearly lows. This is a clear buy signal, which becomes extremely important when we consider also the chart based on the weekly candlesticks.
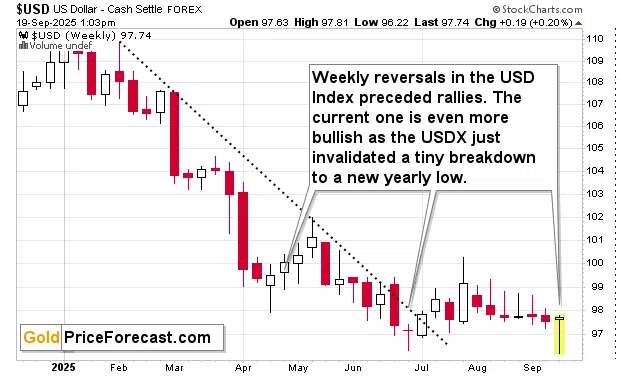
It’s not “just” an invalidation of the breakdown to new yearly lows. It’s a major weekly reversal!
The same kind of reversal that meant local bottoms in April and in June. The difference now is that this is the second bottom, which what used to start huge rallies in the past, but I already wrote about it yesterday – the thing that I want to add on top of that is that the USD Index is UP this week. This makes the implications of the current situation here even more bullish – extremely so.
The question now is… When do we exit the current short positions in mining stocks? That’s something that I’m discussing in the full version of today’s analysis – my Gold Trading Alert.
Note on John T. Seguin’s Performance + Webinar Reminder
The webinar with John T. Seguin, author of the Macrograph Report starts shortly (at 11 AM ET), and I strongly recommend that you attend it your schedule allows it. John’s top September trade (featured below) should be more than enough to convince you that it’s worth it.
The trade that I’m talking about was posted on Sep. 9, exactly 45 minutes before the markets opened in the U.S. (it says “Sep. 9” on the list of posts, but we have the precise timestamp on the admin side of the platform)
The top position was SMCI with the move to $40.50 being the long entry and $40.05 being the stop loss. The latter is important – the risk on this trade was just $0.45 per share.
Here’s how it looked like, before the markets opened on that day.
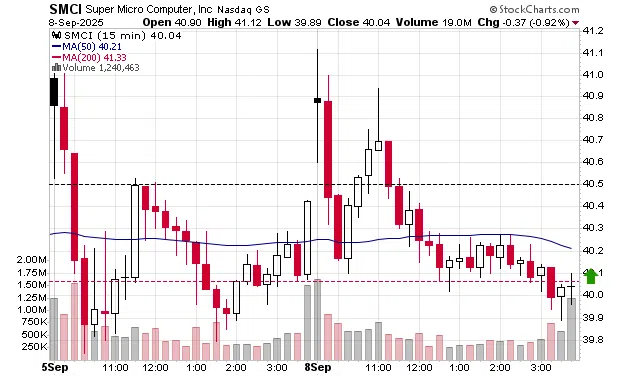
Nothing special, right? Just a relatively narrow, short-term trading range.
The Sep. 8 close was at $40.04, and John’s top trade (#1 on his list) for Sep. 9 was SMCI with a buy level at $40.50.
And here’s what happened next.
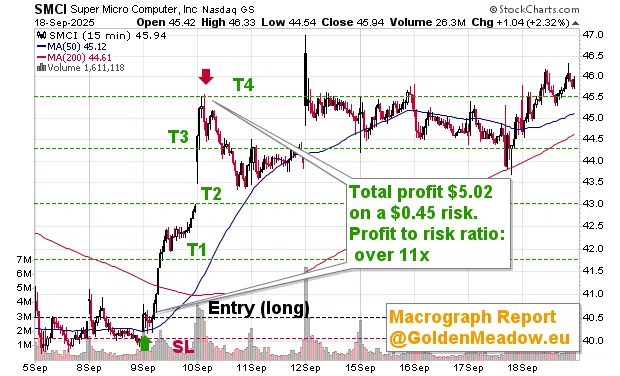
A small rally initially, then a comeback that did not touch the stop-loss, and then a huge short-term rally.
SMCI soared through T1, T2, and T3, and it was finally closed at a profit at T4 at $45.52. By the way, that day’s (Sep. 10) intraday high was $45.57.
That’s a $5.02 profit on a trade that risked $0.45. The profit-to-risk is over 11x.
I’m not making this up – this trade was really this perfect. See it yourself – all the details are present in the first row in the table in the Sep. 9 Macrograph report.
The best thing is that risk was kept in check at all times – once T1 is reached, SL is moved to entry, once T2 is reached, SL is moved to T1 and so on. Either one of the SL levels (often a downside-profit-protect level, not really as stop-loss level as there no loss) is reached or T4 is.
If one paid attention to the position sizing rules that we feature in the Golden Meadow® Portfolio Strategy report, and risked 1.5% of their capital for this trade, they would gain about 16.7% of their portfolio on this single trade!
For a $100k portfolio, that would be a $16.7k gain resulting from risking just $1.5k.
And for a $1M portfolio… You get the idea.
Again, that’s just from a single trade. Of course, not all trades will be successful and neither John, nor myself can guarantee any kind of performance, but if just a single trade was able to generate profit this big (while keeping risk in check), then $5k for a full year of access to the Diamond Package that includes John’s Macrograph Report (did I mention that it’s available exclusively on Golden Meadow®?) is not a lot. Especially it protects one against the price hikes, which are quite likely in John’s case.
The webinar with John starts on 11 AM ET today – I strongly recommend that you be there. If you can’t, the recording will be available, but the ability to ask John questions and see him analyzing the market that you want him to, won’t be.
Thank you.
Przemyslaw K. Radomski, CFA
Founder, Editor-in-chief