Well, was it? Miners showed strength by moving slightly higher while gold moved lower, so…
So, nothing really changed because one swallow doesn’t make a summer and gold didn’t reach its strong support levels just yet. And neither did miners.

The move up in the miners (lower part of the above chart) was tiny, so it’s not that the strength of this signal was profound. It was simply notable.
Besides, here’s what miners did on a daily basis.
They paused. Is this necessarily a sign of a bottom? No. It could be, but it could be just a regular follow-up to a sharp daily decline.
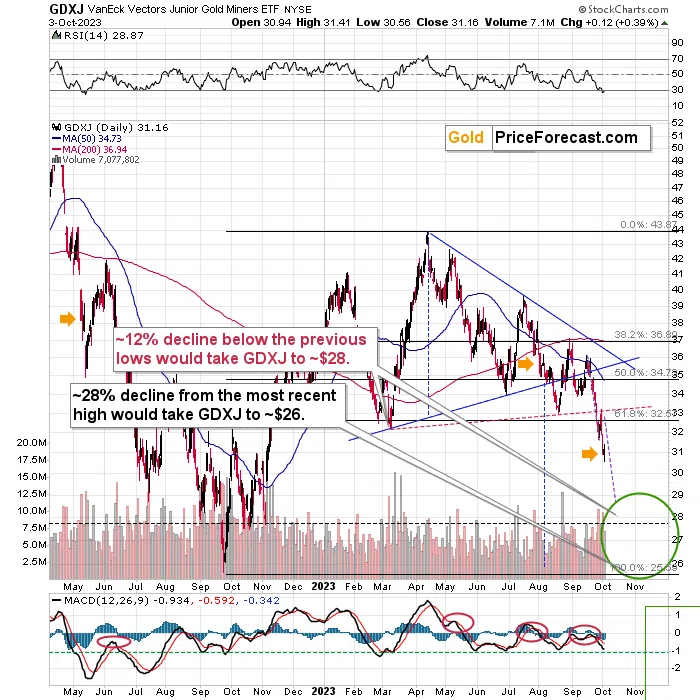
I marked yesterday’s pause with an orange arrow, and I marked two other similar cases in the same way. One was in May 2022, and the other in early August 2023. In both cases, GDXJ was close to the bottom but not yet at that bottom.
Interestingly, in May 2022, we saw that pause when RSI just moved below 30, which is also the case right now.
Consequently, it seems that what we see might be the early warning that a bottom is about to be formed, but not necessarily a clear sign that it’s already in.
In other words, my Monday’s and yesterday’s comments on the above chart remain up-to-date:
The GDXJ topped on Friday at $33.20 and then it declined by almost a full dollar, closing the week at $32.23.
In this way, junior miners verified their move to new 2023 lows through:
- weekly close below the previous 2023 lows
- three consecutive daily closes below the previous 2023 lows
- the comeback to the previously broken support line, which was followed by a decline, which verified the line as resistance.
This means that whatever rally was likely to happen based on Wednesday’s and Thursday’s reversals might have already happened.
The slide to new lows can now continue.
Also, please note that I wrote that I didn’t think that it was a good idea to adjust the short position even despite the possibility of seeing an intraday rally here.
Now, the question is, how low would be too low for the mining stocks. In other words – when are they likely to bottom, at least temporarily?
As you can see on the above chart, I marked a downside target area with green ellipse – that’s where the next bottom is likely to form in my opinion – between the levels slightly above $28 and approximately $26.
Why? There’s no significant support above $28 and the support provided by $26 (the 2022 low) is very strong.
The higher of those targets is supported also by the technique that suggests that at decline that follows a consolidation is likely to be similar to the one that preceded it. We just saw a tiny consolidation and I marked the preceding decline with a purple, dashed line. I copied it to the current situation, and it points to price levels below $29 as the next target. This technique doesn’t have to be precise – it can work on a near-to basis, so the support provided by the October and November (2022) lows seems to be a more likely target.
All this means that the profits in our short position are likely to increase further. The profit-take levels for this downswing remain up-to-date, but if gold futures move close to $1,800, I might quickly adjust them. I will send an intraday Alert in this case.
Thank you for reading our free analysis today. Please note that the above is just a small fraction of the full analyses that our subscribers enjoy on a regular basis. They include multiple premium details such as the interim targets for gold and mining stocks that could be reached in the next few weeks. We invite you to subscribe now and read today’s issue right away.
Sincerely,
Przemyslaw K. Radomski, CFA
Founder, Editor-in-chief