Given all the current world events, gold prices are what they were in 2011. So, what's happening to the yellow metal?
Between 2020 and now, quite a lot happened, quite a lot of money was printed and we saw a war breaking out in Europe. Yet, gold failed to rally to new highs.
In fact, it’s trading very close to its 2011 high, which tells you something about the strength of this market. It’s almost absent.
Truth be told, what we see in gold is quite in tune with what we saw after the 2011 top, and in particular, shortly after the 2012 top. We can also spot similarities between now and 2008. The long-term gold price chart below provides details.
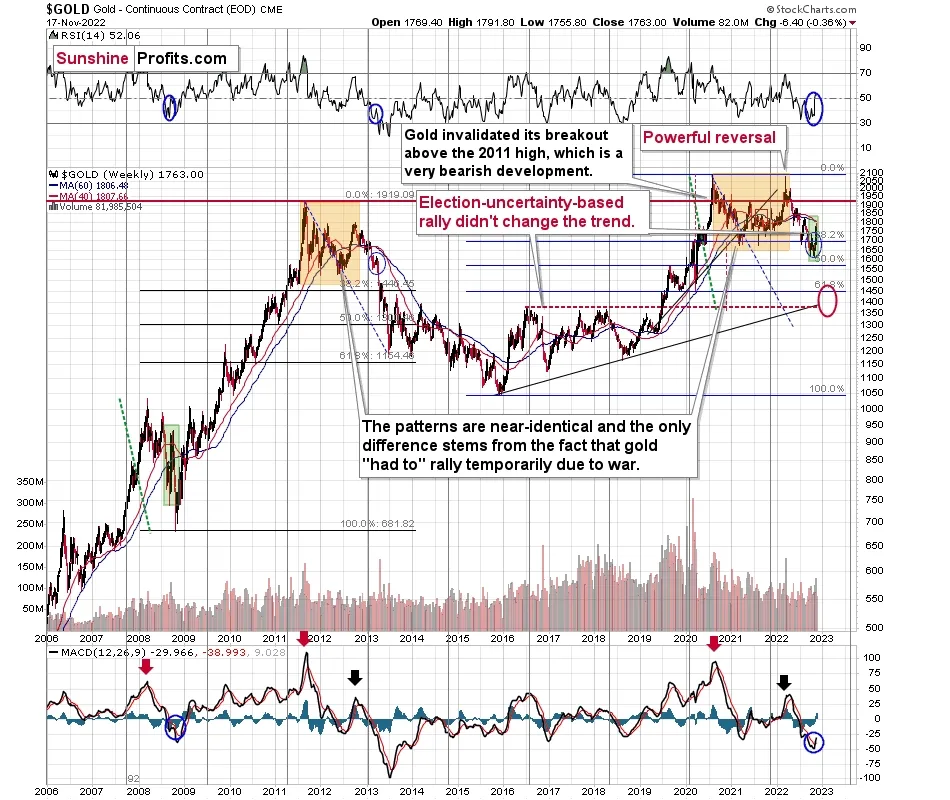
Looking at the gold market from a broader point of view reveals that what we saw recently is something between what we saw in 2013 and what we saw in 2008.
For many months, I've been writing that the situation is analogous to both of the preceding periods, and that the recent sharp corrective upswing fits this narrative rather than breaking it.
Last week’s weekly volume reading was the second biggest reading that we have seen this year. The record was formed in early March – at the yearly top. Does this sound bullish? No, it’s a bearish indication, as history tends to rhyme.
Returning to the 2008 comparison, please keep in mind that the sharp rally seen back then was much larger than what we saw this time. The moves higher in the RSI are similar, and I marked them with blue.
Now, as far as the link to 2013 is concerned, it remains perfectly intact, with the additional note that this time, the final correction that took gold the price back to its 60-week moving average (blue line) was bigger. That’s not that surprising given that the preceding decline was more volatile.
To clarify, it is visible, but what’s visible is still in tune with the final attempt for gold to rally in April 2013, right before the biggest part of the slide.
This week’s performance so far (I’m writing this very early on Friday, Nov. 18) features gold’s reversal. So, unless gold rallies today, we’ll have a weekly shooting star candlestick, which is a very bearish sign, especially when it’s after a rally.
Having said that, let’s zoom in to see gold’s short-term price moves.
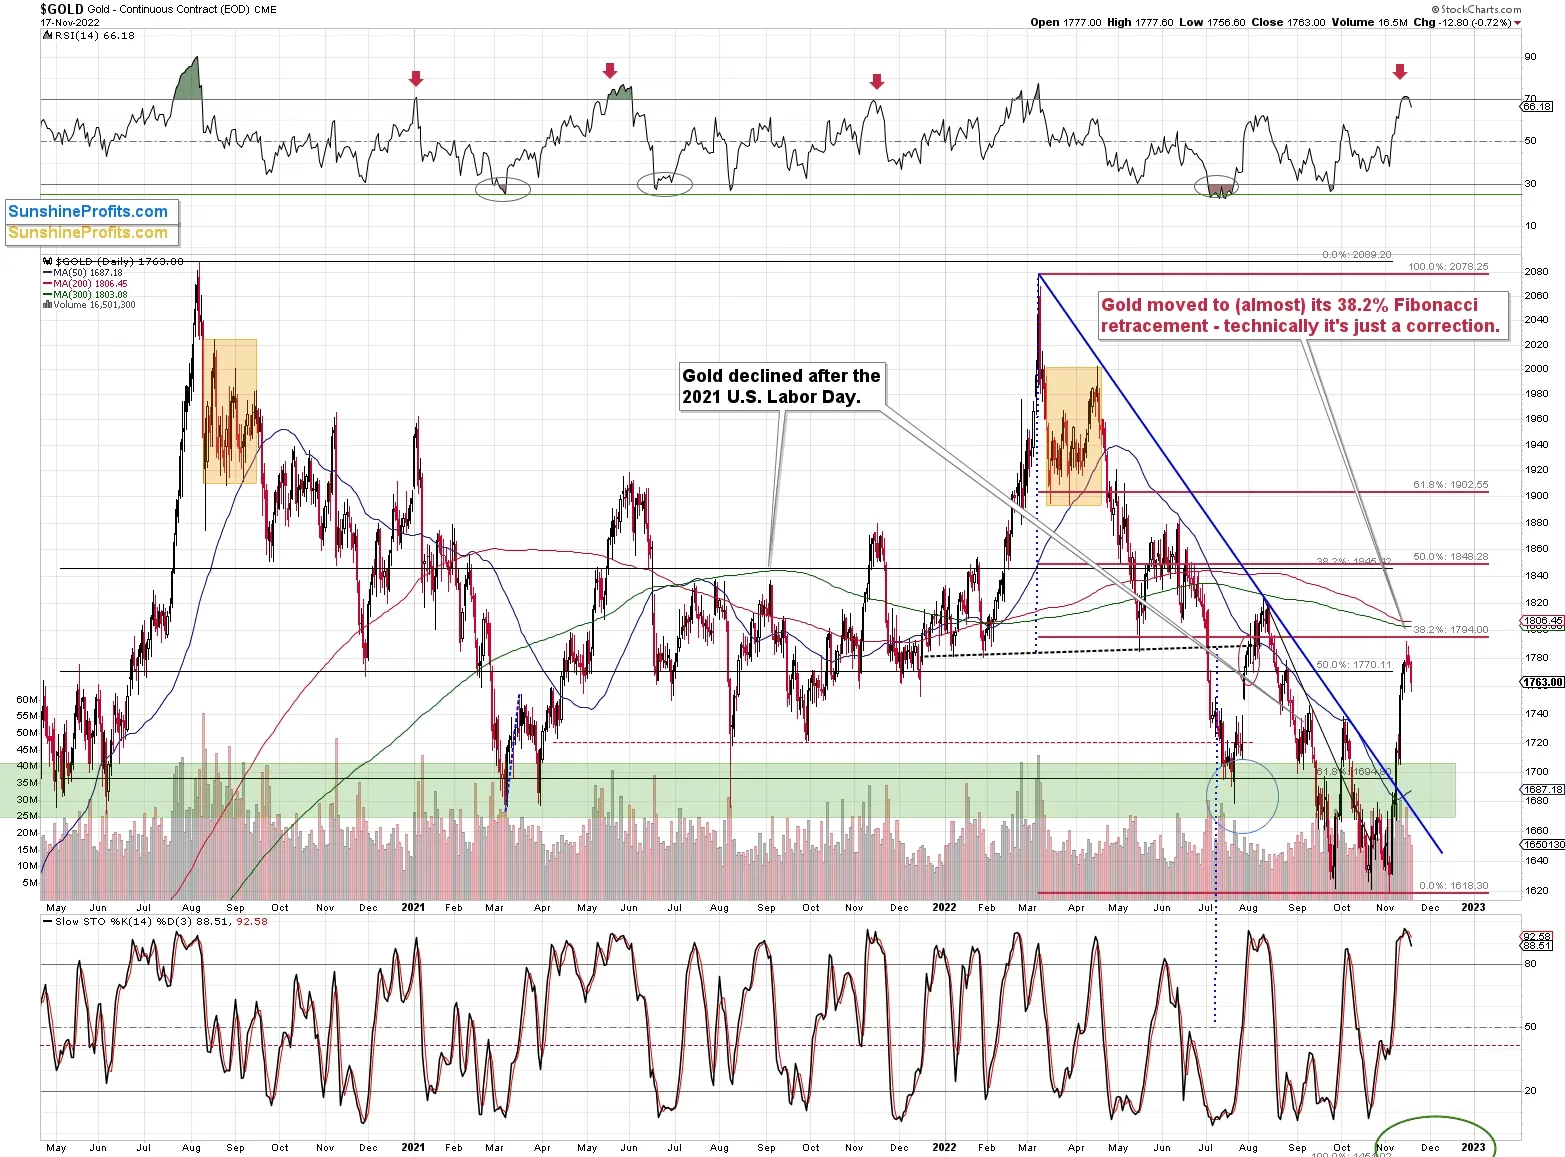
Gold, just like many other markets, recently corrected ~38.2% of its previous move.
Technically, moves that are smaller than the above percentage are usually not viewed as new rallies that would change the trend. They are too small compared to what happened previously to be considered a game-changer, or perhaps, a trend-changer.
In fact, even moves smaller than 61.8% of the previous move are sometimes considered relatively unimportant. The ones that take the market back about 38.2% characterize strong trends – the counter-force (gold bulls in this case) is only able to trigger a rally of this size – less than half of the previous downswing.
Of course, the 38.2% Fibonacci retracement level serves as resistance on its own, and we just saw that in practice.
Not only that, the RSI moved a bit above 70 and then declined below it. This action marked major tops quite many times, including most major 2021 and 2022 tops. It seems that history is about to rhyme, and the gold price is about to slide.
The sell signal from the very overbought Stochastic indicator serves as yet another bearish confirmation.
Let’s keep in mind that the two key fundamental drivers of gold price are: the real interest rates, and the USD Index.
The real interest rates are clearly headed higher ( nominal rates are going up, and eventually inflation is likely to come down), which is bearish for gold.
Right now, gold continues to repeat its 2013 performance, which has extremely bearish implications for the coming weeks.
Przemyslaw K. Radomski, CFA