If silver is outperforming gold, that means it’s off to a good start, right? What do previous patterns say about this?
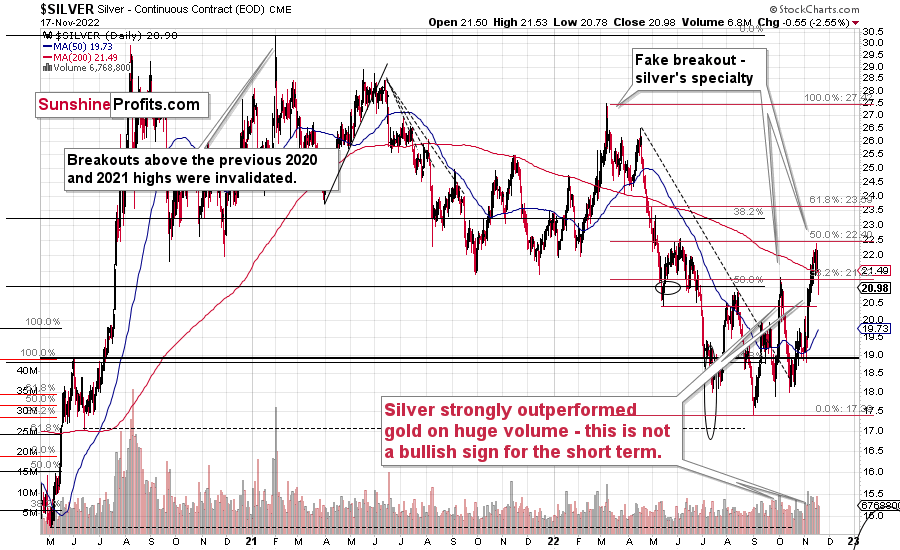
The key thing about the silver market remains its recent outperformance. Unlike gold or mining stocks, silver corrected 50% of its 2022 decline.
Now it moved back below its October 2022 high, but still, silver’s recent rally might seem bullish…
Yes, it appears bullish at first glance, but given my many years of experience on the precious metals market, I can tell you that this kind of performance (silver’s strength relative to gold) is rarely bullish. It’s usually the opposite. Silver soars and breaks above previous highs (or other important resistance lines) only to fool those who are new to this market. And then it slides.
It doesn’t have to happen each and every time, and I can’t guarantee any kind of performance, but the above really does have bearish implications right now.
As I explained in my Nov. 7 video , silver’s short-term outperformance is an important sell signal.
We saw this indication many times before, and it’s been one of the most reliable indications that the next big move lower is at hand. Remember the spike at the 2021 top, when silver soared relative to gold? Many people thought that silver was taking off and heading straight to the moon, but I warned that this was likely a fake move. And indeed, that was the top.
There were times to be long this year (for example, I went long miners on May 12 and on July 11 – very close to local bottoms). However, in my opinion, right now is not a good time to do so. Instead, it seems to me that profits from short positions are likely to grow substantially in the following weeks.
Moreover, let’s keep in mind that the entire July-now period can be viewed as one big flag pattern, and those “continuation patterns” tend to be followed by moves that are similar to the ones that preceded them.
In this case, the move that preceded the flag was a decline from about $28. This means that another move lower in silver is likely to be huge.
Once silver breaks below its 2022 lows, it has little support all the way until its 2020 low. There’s support just below $15, but it’s not very strong, so it might not trigger anything more than a brief correction.
Let’s keep in mind that while gold is repeating its 2013 performance, so is silver.
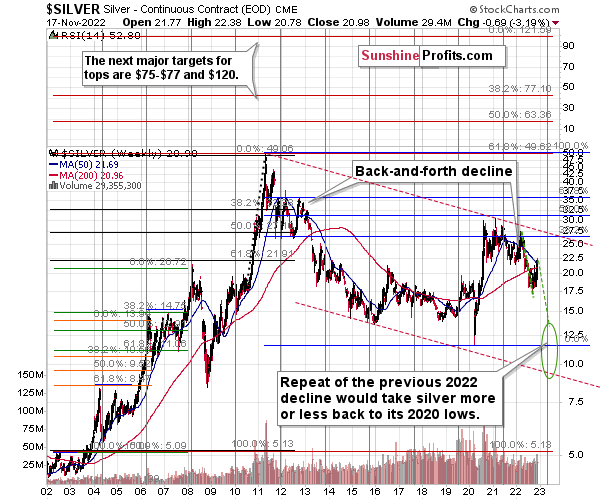
As you can see on the above chart, silver corrected about 50% of the previous downswing, and this correction ended at about $30, a long time ago. Ever since, silver has been declining, and even the outbreak of war in Europe didn’t make silver rally above that level.
On the above chart, you can see how silver first topped in 2011, then declined and formed another top at the cyclical turning point. Next, it declined once again – to the previous lows. After that, silver rallied (in 2012 and 2022), and it topped between its 50-week moving average (marked in blue) and the previous top. Now silver is declining in a back-and-forth manner (you can see it more clearly on the previous short-term silver chart).
Back in 2012, these were just the early days of a gargantuan decline, and the same appears likely to be the case this time. Interest rates are going up after all, and the Fed is determined to quench inflation.
Let’s not forget that rising interest rates are likely to negatively impact not just commodities, but practically all industries. This will likely cause silver’s price to decline profoundly, as silver’s industrial demand could be negatively impacted by lower economic growth (or a decline in economic activity).
Besides, please note that silver didn’t even manage to rally as much as copper (which tried to move to new highs recently) or most other commodities, thus being rather weak.
Consequently, it seems that silver will need to decline profoundly before it rallies (to new all-time highs) once again.
Przemyslaw K. Radomski, CFA