The history of stocks is written in patterns. What are we seeing now which happened in previous years?
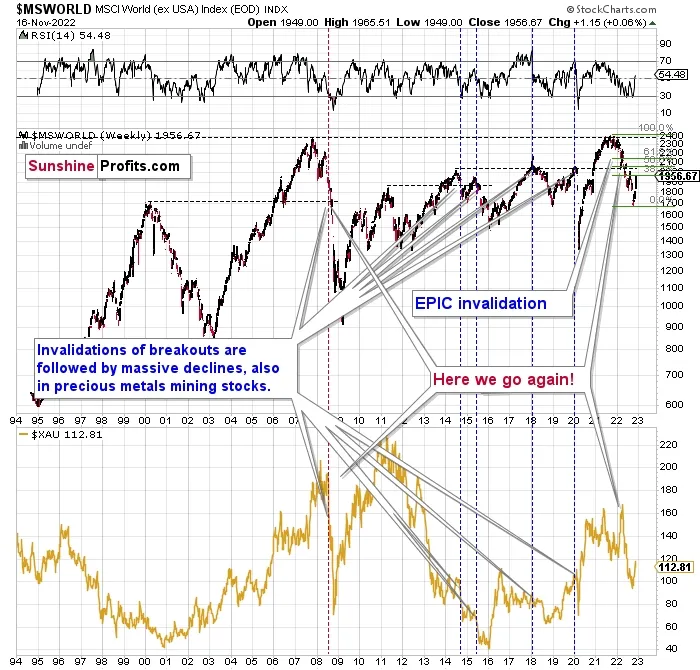
Just as we saw in the case of copper, gold, and mining stocks, world stocks corrected about 38.2% of their preceding decline.
This means that nothing really changed, and the situation remains extremely bearish based on the analogy to what we saw after previous invalidations of long-term breakouts.
As a reminder, in early 2022 I wrote that the situation was very bearish as invalidations of previous breakouts were usually followed by massive declines – not just in stocks, but also in precious metals.
When stocks invalidated their 2006 breakout in 2008, their prices truly crumbled.
We also saw that on smaller scale in 2014, 2015, and early 2018.
And we’re seeing it right now.
To clarify, we’re actually seeing the aftermath of the invalidation. The huge decline is already taking place.
The difference between now and 2008 is that back then the slide was more volatile and we didn’t really see a visible correction during the plunge. This time, the decline is more measured, and we saw a correction to one of the most classic retracements imaginable – the 38.2% one. This correction doesn’t change the trend, which remains down.
Based on what happened in 2008, it seems that stocks are about to move much lower in the following months.
Let’s take a look at the markets from a more short-term point of view, and from the U.S. perspective.
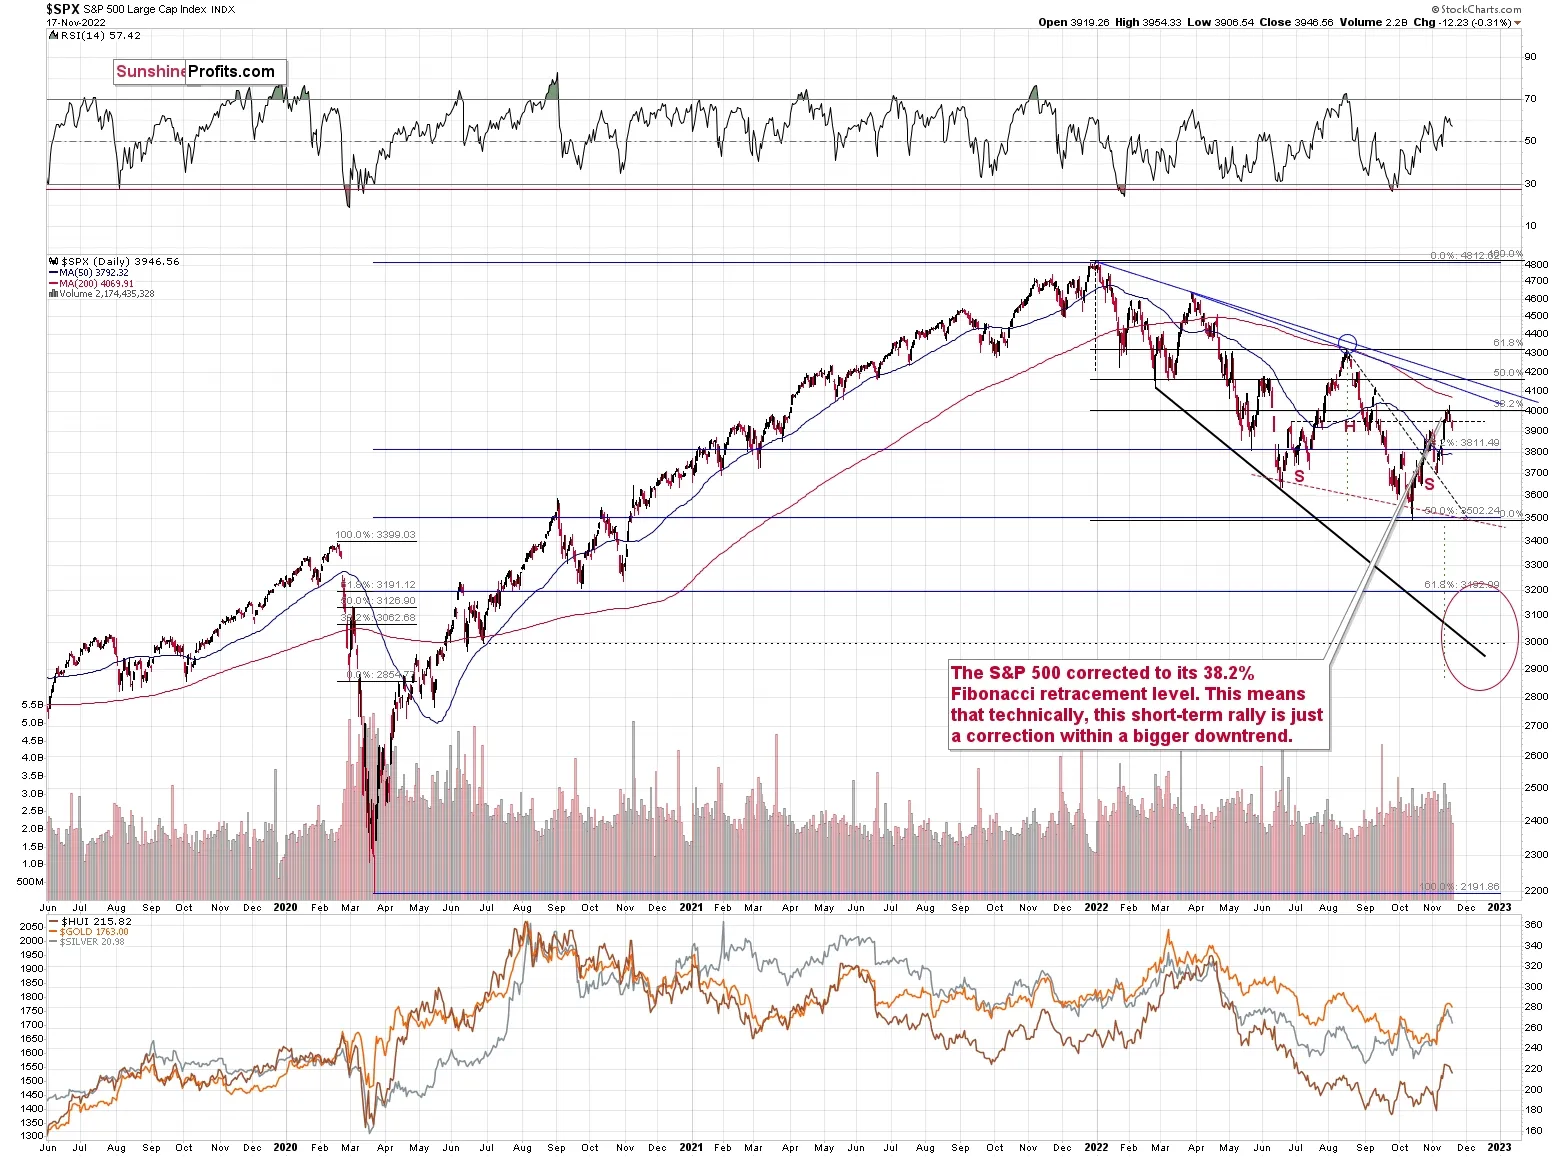
Just like world stocks, the S&P 500 corrected 38.2% of the preceding decline.
Now it’s declining, and it already moved back below the late-June high.
As real rates move higher, it seems likely that stock valuations will decline, and the technical situation supports this bearish stock price forecast.
Przemyslaw K. Radomski, CFA