Gold stocks are no longer whispering – they provide “loud” indications.
Gold stocks quite often lead gold, both higher and lower. And currently, they are no longer whispering – they provide “loud” indications.
Remember when gold, silver, and miners shot up right after Powell spoke? Investors heard “disinflation,” and they probably thought that the “inflation problem” is over, and that it’s all sunshine and rainbows from here, as the rates can now be cut and the economy will get another powerful boost shortly.
Long live the bull market!
Right?
Well, that’s what the initial reaction seems to have been. Here’s the chart that I included in my yesterday’s premium analysis.

I wrote the following:
- Gold (the GLD ETF) moved slightly above its recent high.
- Silver (the SLV ETF) moved higher, but didn’t manage to match even its most recent short-term high – we saw a lower high.
- Junior mining stocks (the GDXJ ETF) moved higher, but didn’t manage to hold above their Jan. 9 high.
Consequently, while we don’t see any indication from the gold-silver dynamics, we see that mining stocks underperform gold, and we also see that junior miners are weaker than senior miners.
The underperformance of gold miners is bearish—it's really that simple.
The fact that miners failed to move above their Jan. 9 high is also telling.
Now, let’s see how fast investors became disillusioned, at least with regard to the part about Powell’s speech.

“Nope, nope, nope” was the name of the game yesterday.
It took gold (GLD) just a few hours to move from a monthly (Feb) high to a monthly low.
We saw the same thing in the case of mining stocks, both senior (GDX) and junior (GDXJ).
This is very bearish. It shows just how unfounded Wednesday’s rally was. This also revealed a specific weakness of the precious metals market – a technical one.
Technical analysis is a tool that helps put recent price movements into context. One of its key tools are price formations.
How do formations work? Simply put, whenever the price creates a certain shape through its movement, something specific tends to happen.
In the current case, the GDX and GDXJ prices formed a so-called “head and shoulders” pattern. That’s one of the types of top formations. As the name suggests, the price is likely to fall after the formation is completed. The completion of the formation depends on whether the price is able to break the “neck” of the pattern – I marked them with red, dashed lines.
Mining stock prices are currently trading at those levels, but if they move lower - which is likely due to the multiple reasons I discussed yesterday - this formation will be completed (technically, we need to see 2-3 closes below the neckline to say that the move was confirmed) and the move lower will continue.
The silver price’s sudden intra-day outperformance is also a great reason to think that the next big move is to the downside. The silver price tends to fake breakouts and its strength right before a move in the opposite direction. Some might say that silver is one of the most difficult markets out there for beginning traders because of its counterintuitive specifics – and they wouldn’t be wrong.
Moreover, focusing on mining stocks reveals that they are once again repeating their previous pattern, which – while lacking a fancy name – has very important implications.
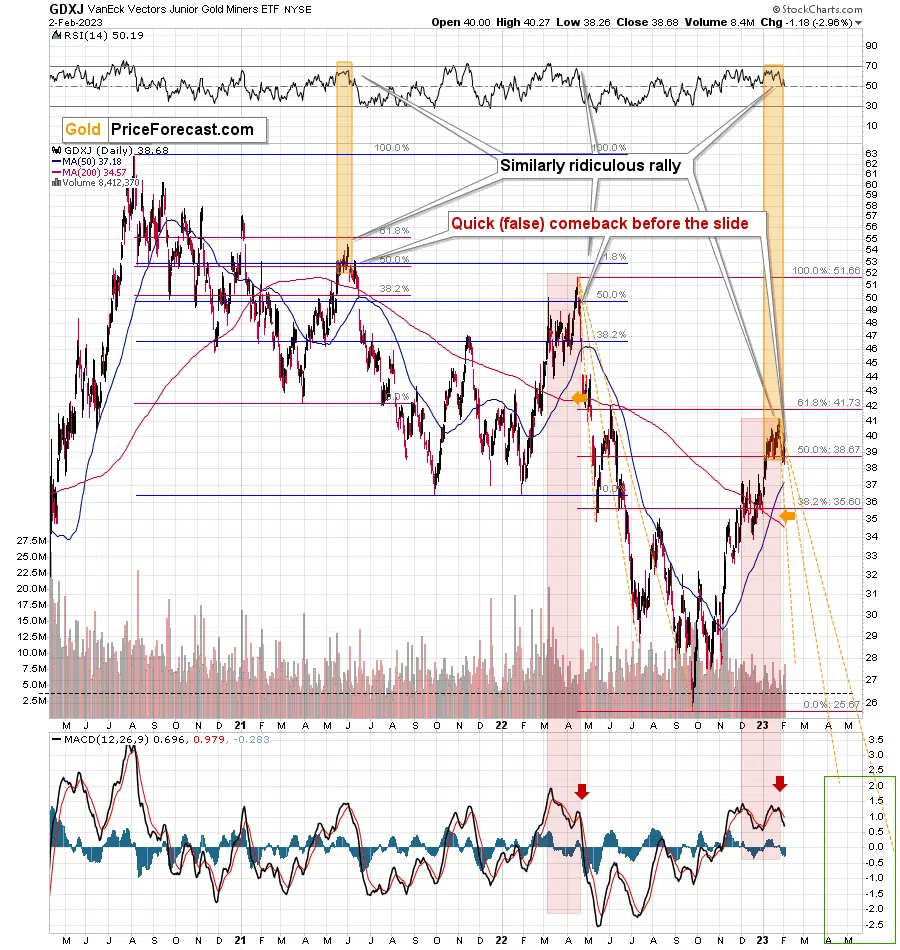
Namely, the link between the current situation and what we saw in June 2021 and April 2022 (right after the tops!) remains intact. History tends to rhyme, and it seems that we’re about to see a very bearish verse.
In both previous cases, there was a small – but sharp – daily upswing before the decline continued – and we just saw that after Powell spoke. In the case of the 2021 analogy, we can see the similarity even in the RSI indicator, where it moved slightly up from about 50.
Consequently, the bearish implications remain intact, as does the sell signal from the MACD indicator that is already bearish on its own (this indicator flashes a sell signal when it – black line – moves below its signal line, which is marked in red), but it has an additional bearish meaning because it shows how the current situation is indeed similar to what happened at the 2022 top.
All in all, there are reasons to think that the next big move in mining stocks (and the rest of the precious metals sector) will be to the downside. And – while I can’t promise any kind of performance – that a lot of money could be made thanks to this upcoming slide.
Thank you for reading our free analysis today. Please note that the above is just a small fraction of the full analyses that our subscribers enjoy on a regular basis. They include multiple premium details such as the interim targets for gold and mining stocks that could be reached in the next few weeks. We invite you to subscribe now and read today’s issue right away.
Thank you.
Sincerely,
Przemysław K. Radomski, CFA
Founder, CEO