The markets look ready. The writing is on the wall. The only remaining thing is the trigger – the spark.
And it might come from the USD Index.
Sure, there are many other places where something major could happen that would have a spillover effect for other markets, but the way things are performing right now suggests that the USDX is a good candidate for that.
First, let’s see why the situation is so tense.

After topping in early February, gold tried to move to new highs three times, failing in each case. The higher lows suggest that tension is rising.
Of course, rising tension could mean that gold is gathering strength for a breakout. But seeing how gold failed to hold at new highs even though the USD Index moved to new lows recently and at the same time, miners already started their own slide makes it clear what kind of action is likely to follow this pressure. The golden balloon is likely to pop any day now.

The USD Index corrected to its 38.2% Fibonacci retracement level based on the entire recent rally, and it also corrected in an ABC (zigzag) pattern. Both are book-examples of corrections.
38.2% Fibo Details for the USD Index
The 38.2% Fibonacci retracement is an important level derived from the Fibonacci sequence (0, 1, 1, 2, 3, 5, 8, 13, 21...), where each number is the sum of the two preceding ones. When dividing each number by the next, the ratio approaches 0.618 (the golden ratio), with key retracement levels at 23.6%, 38.2%, 50%, 61.8%, and 78.6%.
This sequence isn't just a mathematical curiosity – it's deeply embedded in natural structures all around us. For instance, the 38.2% proportional relationship appears in the spiraling pattern of pinecones, where each scale is positioned approximately 38.2% of the way around the cone from the previous scale. We see it in the branching patterns of trees, where secondary branches often form at about 38.2% of the distance from the trunk to the tip of primary branches. Even in the human body, the ratio of forearm length to total arm length closely approximates 38.2% in many individuals.
Markets, being created by humans who are themselves part of nature, often unconsciously reproduce these same natural proportions. When a trader instinctively feels that a pullback has gone "far enough but not too far" to maintain a trend, they're often unknowingly responding to these universal proportional relationships. What feels "right" to the collective market mind frequently aligns with these Fibonacci relationships – particularly the 38.2% level that balances shallow correction with trend continuation.
Think of the 38.2% retracement like a marathon runner pacing themselves – after an intense sprint (the primary trend), they don't stop completely but slow down to about 38% of their maximum pace to recover energy before accelerating again. This level represents the perfect balance between necessary rest and maintaining momentum.
For the USD Index, the 38.2% retracement level works particularly well because it represents a critical balance point – not so shallow that it fails to relieve overbought conditions, but not so deep that it threatens the primary trend. Institutional traders and algorithms often set limit orders at these mathematical points, creating self-fulfilling support and resistance zones.
What makes the USD Index's recent correction especially textbook is that it not only stopped precisely at the 38.2% retracement level of its entire rally, but it also formed a classic ABC zigzag correction pattern. This double confirmation suggests the correction is likely complete and that the original uptrend remains intact. The measured nature of this pullback suggests the USD Index is now primed for continuation of its upward move – which historically has triggered significant downside moves in precious metals.
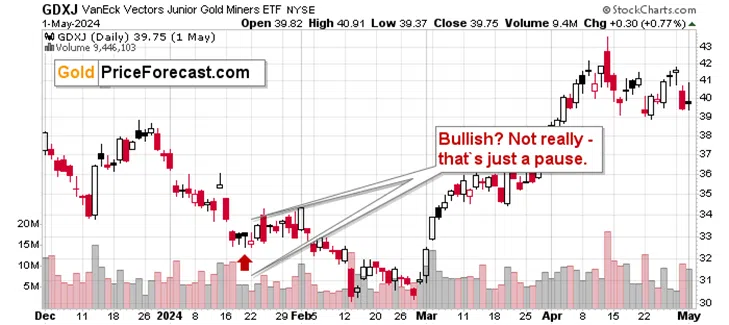
Low-volume Hammer Candlestick in the GDXJ
Miners’ underperformance is also clear. While gold tried to move to new all-time highs, miners were not even able to move above late-2024 highs. In fact, in yesterday’s trading, we just saw a rebound and nothing more.

Some might say that it was a bullish hammer reversal candlestick, but the implications are not really bullish because of the low volume that accompanied that reversal. This is important.
The bullish hammer formation we see in GDXJ might appear positive at first glance, but volume tells the real story here. A hammer candlestick forms when sellers push prices down significantly during the session (creating the long lower shadow), but buyers eventually gain control, closing the price near the high of the day. This pattern typically signals that sellers are exhausting their momentum and buyers are beginning to take control.
However, for a hammer pattern to have genuine bullish implications, it must be accompanied by strong volume. The volume represents market conviction – how many market participants actually believe in the reversal.
This relationship is like a political election – a candidate can claim widespread support (the price action), but if voter turnout is minimal (low volume), the victory lacks mandate and legitimacy.
Similarly, in GDXJ's case, the low volume accompanying this hammer pattern effectively neutralizes its bullish implications. It's comparable to a courtroom where a compelling argument is made, but the jury isn't paying attention – the verdict cannot be trusted.
Low-volume hammers often represent temporary lulls in selling pressure rather than genuine buying interest. They frequently appear during downtrends as brief pauses before the selling continues. Professional traders typically view these patterns as potential short-selling opportunities, not buying signals.
Here are two example when we've seen this volume-price relationship play out in the GDXJ.

August 2022: GDXJ formed a perfect hammer candlestick after a sharp decline, but volume was below its regular levels. Despite the seemingly bullish pattern, prices fell much more in the following weeks.
January 2024: A textbook hammer (actually, a few of them) appeared on GDXJ with low volume levels. What followed was not a rally but a consolidation that was followed by more declines (it was about 2.5 months before the bottom).
Given the broader context – with gold failing to make new highs despite USD weakness and miners already showing notable underperformance – this low-volume hammer is more likely a prelude to further declines than a genuine reversal signal.
What does that leave us with? A gold market that’s likely to slide any day now (which doesn’t necessarily imply one’s IRA (gold) holdings, or the case when gold is providing income, but might really affect their trading capital).
Invalidations, Invalidations Everywhere

Besides, stocks’ invalidation didn’t help with the bullish picture for multiple markets.
And neither did bitcoin’s inability to stay above $100k.

In fact, the latter is even below $90k.

Silver failed to hold above its late-2024 high (and silver didn’t even move close to its 2024 high).

The same with copper – it just failed to rally above its late-2024 highs, and it invalidated its breakout. Now it’s declining in a back-and-forth manner. That’s particularly interesting is that the previous attempt to move above the 61.8% Fibonacci retracement level that also failed was followed by back-and-forth movement as well – the analogy continues. This means that the chances for decline’s acceleration are quite high – that’s what happened in the analogous time in late 2024.
Multiple markets are unable to move to new highs and are invalidating their breakdowns. What is the thing that would impact all of them and trigger declines that they appear to be preparing for?
That’s right, you guessed it – it’s a sizable rally in the USD Index.
And you know which two stocks are likely to be affected to a huge extent (except for the GDXJ ETF)? FCX and NEM. However, I’ll stop today’s free analysis here – the full version includes profit-take levels and details for all the above. I hope and trust that the above is enough to help you position yourself in tune with the upcoming market waves. And, if you’d like to get more details, we invite you to join us.
If you want the best, you’ll find it in our Diamond Package. There are many other premium plans available, though. Choose the one that suits you the most. And if you’d simply prefer to stay up-to-date with what we have available for free, our free gold newsletter would be a good choice – sign up today.
Thank you.
Przemyslaw K. Radomski, CFA
Founder, Editor-in-chief