What can be read from one gold chart?
Remember the one ring to rule them all? Today, we prepared for you the one precious metals chart to rule them all – in terms of importance.
The chart features all key parts of the precious metals sector and one of its two key fundamental drivers: gold, silver, mining stocks, and the USD Index. The other fundamental driver is the level and trend in the real interest rates (which I discussed on Thursday).
Without further ado, here it is.
The annotations on the chart already reveal the most important events that occurred. Namely, it’s all about the weekly reversals!
On an intraday basis, prices move back and forth somewhat randomly, somewhat based on events that are temporary or relatively unimportant, and sometimes based on big individual transactions. All in all, those price moves are usually not reliable enough to say much about a change in the trend or about anything else.
Of course, the “experts” out there will always “know” the reason behind all price moves, but in many cases, the “experts” are journalists that are tasked with writing something, and since they have to write something, they will just take the easy road, find an “important statistic” that was released on that day (there are many statistics released on each day, so they will just “pick” one that seems most important), and create a title that says “gold does THIS on THAT,” e.g. “gold soars on increase in Indian gold exports by 0.01%,” just look at the titles of the gold price news.
The problem is that people are mistaking the fact that both events happened on the same day for the causality. Just because they happened almost simultaneously doesn’t mean that one caused the other. In the preceding example, gold could have simply rallied due to a technical pattern (which journalists are rarely aware of) or it could have been a sell-the-rumor-buy-the-fact market reaction to something completely different.
Why am I writing all this? To emphasize that price noise and “news noise” are common, and it’s not easy for someone new to the markets to differentiate between what is important and what isn’t important but is just portrayed as important by people who are pretending to know the reasoning behind a given market’s price moves simply because it’s in their job description. The quality of the source of the information matters, as long as your capital matters to you.
Moving back to the price noise, one way to deal with it is to ignore what’s happening on an intraday basis and look at just the daily closing prices. Some investors and traders prefer to analyze prices from this point of view, completely ignoring intraday price movement. That’s how some charts are created as well.
While daily closing prices eliminate part of the problem with price noise, they too could be pushed by various parties and can sometimes be viewed as not clearly informative.
To be honest, one can never be 100% certain that the price they choose to use is completely accurate, but there are several ways to ensure (precisely: greatly increase chances, as there are no certainties in any market) that one is indeed focusing on what truly matters. These include:
- Focusing on weekly price moves and weekly candlesticks (which include intraweek lows and highs, but one of the key parts in them are the weekly opening and closing prices).
- Focusing on whether markets that should be moving together (here: gold, silver, and mining stocks) are indeed moving together and flashing the same signals.
- Focusing on whether the markets that are likely to drive the prices of other assets are moving in a direction that supports the indications from the main market that one is analyzing (in our case, gold is the main market and the USD Index is the driver).
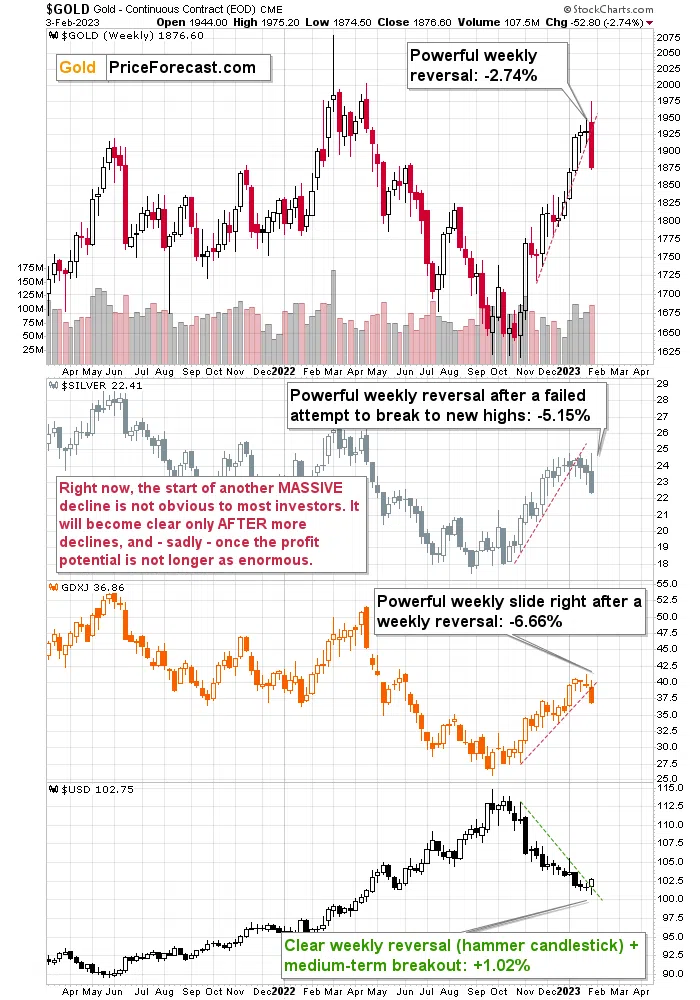
Keeping all the above in mind, let’s take one more look at the “one chart to rule them all.” In fact, now it’s clear why I called it that. Here are the key facts about the precious metals sector:
- Gold flashed a powerful weekly reversal candlestick and declined by 2.74% last week.
- Silver flashed a powerful weekly reversal candlestick, and it declined by 5.15% last week.
- Mining stocks declined profoundly right after a weekly reversal candlestick, and the GDXJ ETF declined by 6.66% last week. That’s extra bearish, because gold stocks tend to lead gold, so the fact that the bearish indication flashed one week earlier in the case of miners is an additional bearish sign.
What about one of the key drivers of the gold price – the USD Index?
It formed a powerful weekly reversal candlestick, called a “hammer candlestick.” Not only that – at the same time it broke above its declining medium-term resistance line (marked with green). This is a perfect confirmation of the bearish indications coming from gold, silver, and mining stocks. The USD Index is inversely correlated with gold, thus a bullish reversal in the USDX is a strong bearish sign that confirms the bearish reversal across the precious metals market.
Do these weekly indications work? Yes, they do. It doesn’t mean that they are a 100% certain tool for making gold price forecasts. Of course not – there are no such tools, and one needs to apply many of the useful and time-tested tools before entering into a trading position. While I cannot guarantee anything, I can tell you that all four of my trades in the previous year that were based on this type of indicator were profitable (two of them were long trades in the precious metals sector and two were short trades). My current trade remains open, and its potential – in my opinion – is truly enormous.
Now, after this dramatic slide that took gold about $100 lower in less than 48 hours, it’s normal for the precious metals market to take a breather, and we see it in today’s pre-market trading (chart courtesy of SilverPriceForecast.com)
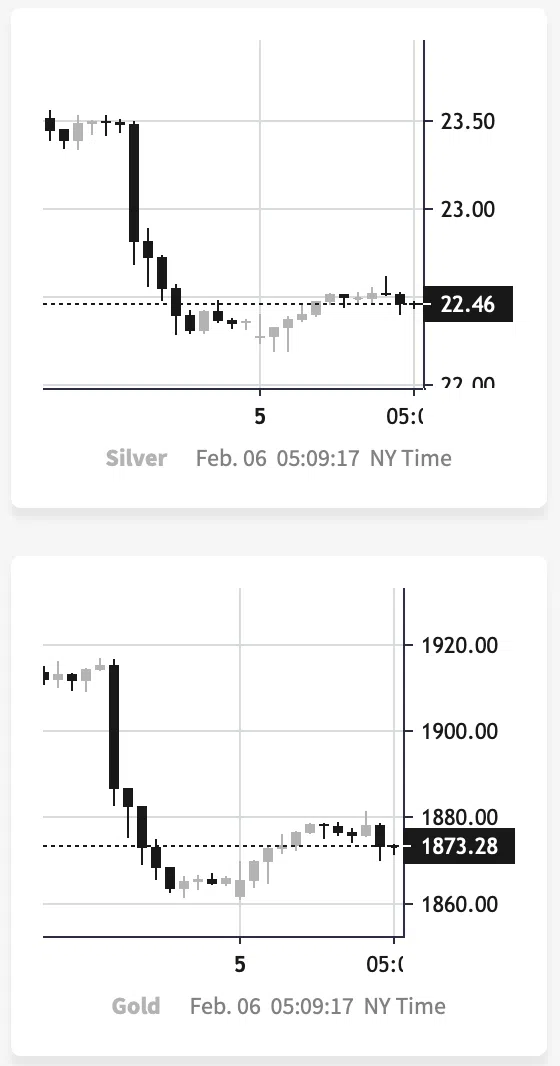
Both metals are up, but it’s “small potatoes” compared to the size of Friday’s decline. It’s not bullish – it’s a regular reaction. If you see some kind of “gold soars on XYZ statistic,” well, the odds are that it could be far from reality, as today’s rebound is something that was likely to happen based on just the size and sharpness of Friday’s downswing – no other reason is necessary for this.
In my view, the real interest rates are up and about to soar higher, the USD Index has most likely bottomed, and the precious metals have topped in a spectacular manner. The rally in gold, silver, and miners was indeed sizable, but… It’s over.
What’s next? Something exciting or something scary – depending on how positioned and informed one chooses to be.
Thank you for reading our free analysis today. Please note that the above is just a small fraction of the full analyses that our subscribers enjoy on a regular basis. They include multiple premium details such as the interim targets for gold and mining stocks that could be reached in the next few weeks. We invite you to subscribe now and read today’s issue right away.
Sincerely,
Przemyslaw K. Radomski, CFA
Founder, Editor-in-chief