


[Exclusive to GoldenMeadow.eu and GoldPriceForecast.com]
Gold settled Thursday at $4,298, down $26, its lowest close since early August. The 10-year yield touched 5.145 percent, its highest since the financial crisis, the 30-year reached 5.44 percent, its highest since 2004, and New York Fed President Williams said the Fed will likely need to hike again this year. Brent rose 3.4 percent to $106.60 after a Houthi missile attack on Saudi Arabia.
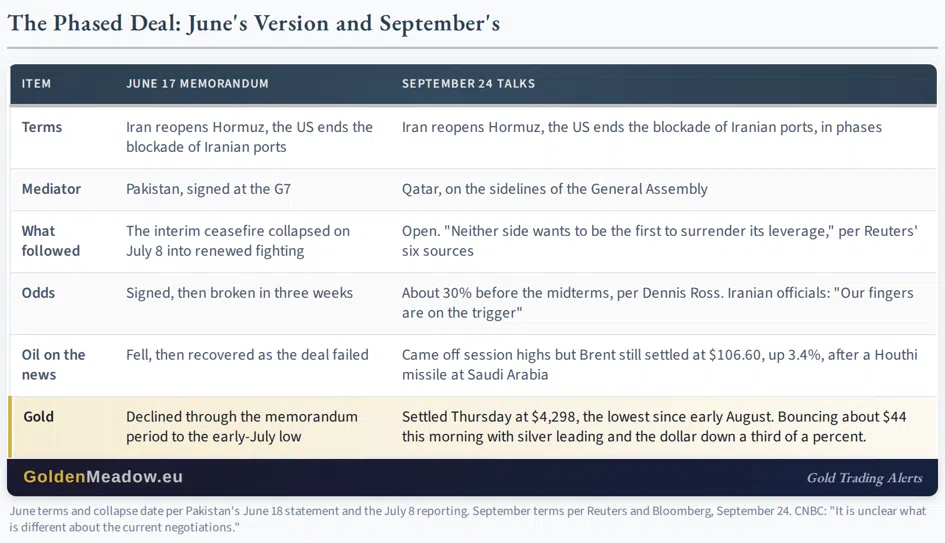
This morning gold is up about $44 near $4,342, with silver up almost twice as much, the dollar down a third of a percent, and oil giving back about 2 percent. The reason is a Reuters report that US and Iranian negotiators are exploring a phased deal: Tehran reopens Hormuz, Washington lifts the blockade. Those are the terms of the June 17 memorandum, which collapsed on July 8.
The Same Deal, Three Months Later
CNBC's line on the report is the honest one: "It is unclear what is different about the current negotiations." Reuters' six sources say neither side wants to surrender its leverage first, Dennis Ross puts the odds of a deal before the midterms at about 30 percent, Iranian officials told reporters "our fingers are on the trigger," and the Houthis fired at Saudi Arabia the same afternoon. Oil came off its highs on the report and still settled up 3.4 percent.
Yesterday I wrote that "crude oil is back above its previous high" and that another rally might take it toward its 2026 high. Thursday delivered the rally.
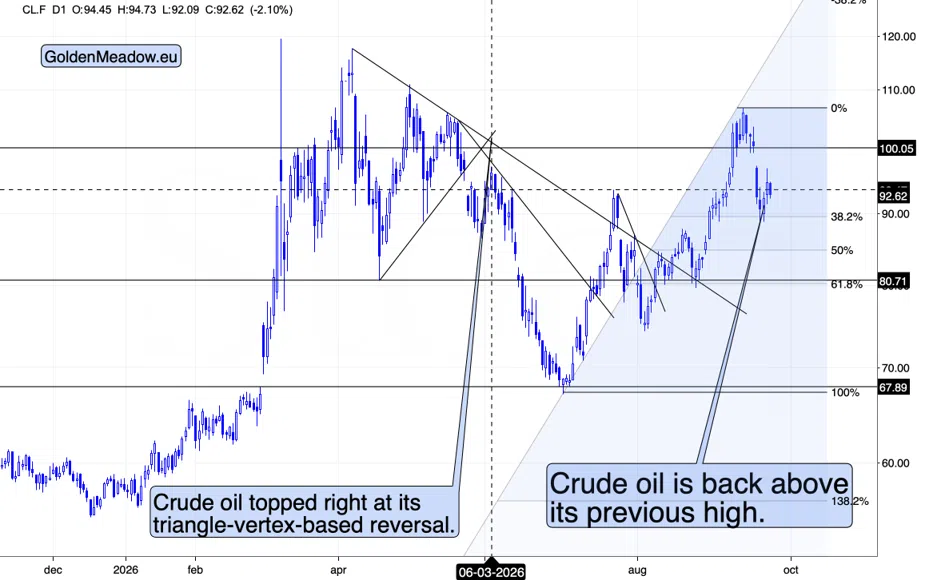
This morning's pullback is the market pricing a headline it has priced three times this month, for a session each time.
Also, please note that crude oil bounced after reaching its 38.2% Fibonacci retracement. This suggests that the corrective downswing might be over.
Gold: Below The Line, Then A Bounce
Yesterday, I wrote: "The quiet is the market waiting to see whether the neckline holds a daily close."
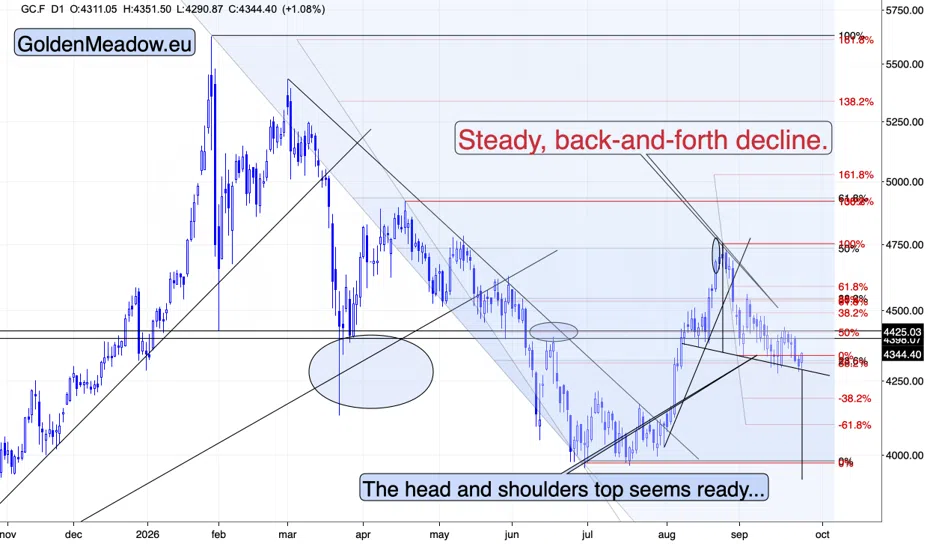
It did not hold on Thursday. Gold closed at $4,298, its lowest since early August and, on my chart, below the neckline of the pattern I have been describing since September 4. The chart decides the precise reading, and I will show it below, but the settlement is the settlement, and it came with no intraday reversal for a third session. This morning's bounce arrived with silver leading, up almost twice as much as gold, and with the dollar down and oil down on the same headline.
At the first sight, it’s nothing new – it’s another rebound from the $4,300 range – each smaller than the previous one. However, there’s much more to those price moves than just that.
The Key Technical Development: 2012-2013, Again
Step back from the daily bounces and the chart is doing one thing: a steady, back-and-forth decline from the late-August top, four weeks long, with lower highs and lower lows.
We have seen this setup before, on a weekly scale – most recently in the Labor Day Special. In late 2012, gold's corrective rally ended with a breakout above its declining resistance line that was bullish only in the short run, a retracement to the 61.8% Fibonacci level that changed nothing about the bearish outlook, and then a steady, back-and-forth decline that ran from October 2012 into April 2013 before it broke down and accelerated. That acceleration took gold from about $1,560 to $1,180 (almost 25% lower) in just a few months.
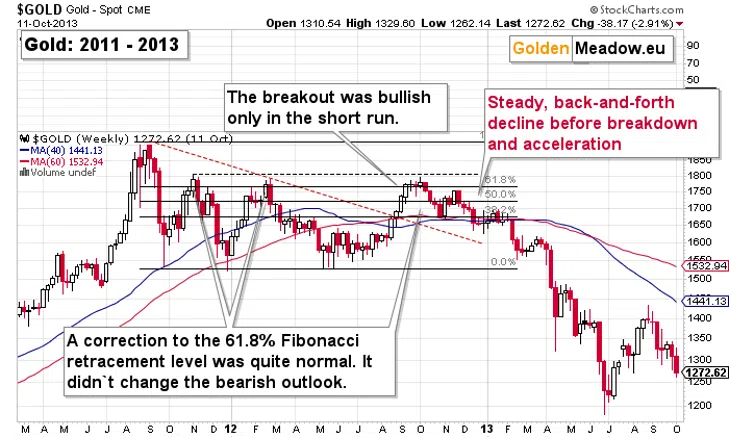
The 2026 version has the same parts in the same order. The late-August move above the declining resistance line was bullish for a few days and then invalidated. The rally retraced about half of the decline before it, which is the normal kind of correction. And what has followed is the same steady, back-and-forth decline, with the daily bounces on peace headlines standing in for the weekly 2013 ones.
On September 7, I wrote the following about this analogy: "What differs is the speed. The 2011 top and the 2012 corrective top were thirteen months apart, and this year's were seven months apart. If the compression holds, the six-month grind that preceded April 2013 would be closer to three."
Four weeks into this grind, the compression is holding. The moves are quicker, and that is the only difference. The implications are the same as they were in the first quarter of 2013: extremely bearish for the medium term, with the back-and-forth phase as the setup and the breakdown as the event.
The entire – final – decline back then took gold from about $1,800 to about $1,200 – 33% lower. In the current situation, with the starting point at $4,750, we could see gold at $3,167 in a few months. The move below $4,000 will be just the first step. Of course, the above is up-to-date at the moment of posting this and the situation may change in the future. I will keep my subscribers informed as the situation develops.
Thank you for reading the free version of today’s analysis. More on the above technical and fundamental issues as well as analysis of other markets (plus the profit-take levels for our trading positions and details of our investment/insurance positions) is available in its full version. I encourage you to subscribe for the premium version today. If you’re not ready to subscribe yet, I encourage you to sign up for my free gold newsletter now.
Thank you.
Sincerely,
Przemysław K. Radomski, CFA