


Yesterday, I wrote: "The dollar has done its part. The one support gold has left this week is cheaper oil, and today is the day oil might turn."
It turned. WTI fell more than 2 percent to about $87.40 on Tuesday morning and then reversed to settle at $89.44, up a penny, and Brent recovered from below $99 to settle at $100.58. Gold rose $30.30 to $4,187.10 on Tuesday as the dollar slipped 0.27 percent and Treasury yields eased from their highest levels since 2002. This morning the dollar is rebounding ahead of today's Fed minutes, back near 102.1, gold is down about $32 near $4,155, and silver is falling much faster than gold.
Two things matter more than the daily moves. Crude oil bottomed on the exact day the triangle-vertex technique flagged, and the USD Index completed the verification of its breakout.
Oil's Reversal
Yesterday, I wrote: "Crude oil is declining right into its triangle-vertex-based reversal." And: "Today, it is declining into one, which means the reversal has bullish implications for crude oil."
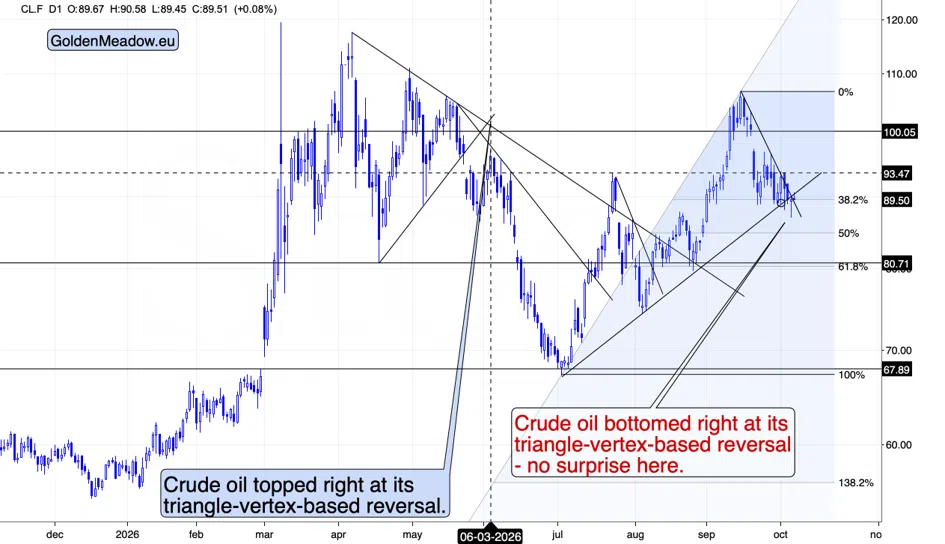
Crude oil bottomed right at its triangle-vertex-based reversal, on the exact day the technique flagged, and that is no surprise. Crude fell through its late-September low in the morning, the selling ran out within hours, and the session ended with a long lower shadow on the daily chart and a close above the open. WTI is slightly higher again this morning, near $89.50. The same technique marked crude's early-June top, right at that vertex.
To be clear – it will be certain that the bottom is in fact in only after the black gold rallies even more. For now, it’s already very likely.
Why A Failed Breakdown Often Marks A Bottom
Tuesday's session in crude oil is worth a closer look, because the pattern behind it applies to every market, gold included.
Obvious lows attract orders. Traders who own the market place their stop-loss orders right below the prior low, and traders who want to sell a breakdown place their entry orders in the same spot. When the price breaks the low, those orders fire together, and the price drops quickly. If that is the last of the selling, there is nobody left to push the price lower, and buyers who were waiting for a better price take the other side. The price climbs back above the broken low, and the traders who sold the breakdown are now short below the market. Their buying to cover adds fuel to the rebound.
The result is a failed breakdown: a break below a prior low that reverses within the same session. It tells you that the remaining sellers have sold, and it often marks a bottom, especially when it happens at support. The close is what matters. A close back above the broken low, and above the day's open, shows that the buyers won the session. The confirmation comes over the next few sessions, if the market does not make a new low.
That is what crude did on Tuesday. WTI broke below its late-September low of $88.58, fell to about $87.40, and closed at $89.44, above the broken low and above the day's open, at the rising support line and on the day the triangle-vertex technique flagged. Three separate signals pointed to the same session. This morning, WTI is slightly higher, so the first part of the confirmation is in place.
The mirror image works at tops: a break above a prior high that fails within the same session often means the last buyers have bought. When you see either pattern on gold, silver, or the USD Index, treat the close as the signal and the next few sessions as the test.
The fundamentals did not change overnight: Gulf exports are recovering, and the G7's diesel is on its way. What changed is that the market stopped falling on that news, which is how bottoms usually form. Yesterday, I explained why diesel matters more for inflation than crude, and why the long end of the bond market kept rising while crude fell. If crude now rises from here, it adds pressure to an inflation picture in which diesel never got cheap, and through the oil-rates-USD-gold link, that is bearish for the precious metals.
The Dollar Verified Its Breakout
Yesterday, I wrote: "Monday's close was the third straight daily close above the previous 2026 highs, which confirms the breakout."
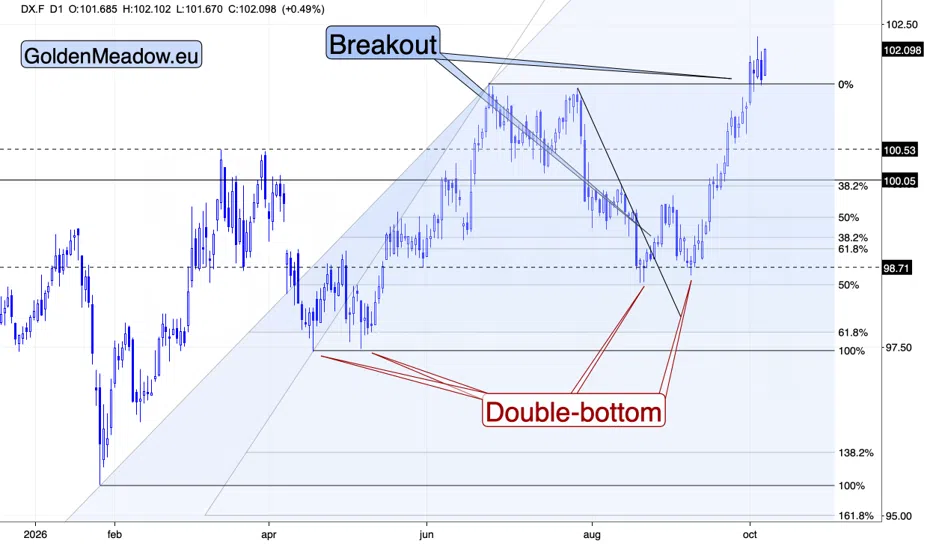
On Tuesday and early today, the index dipped back to those previous 2026 highs, and it has rallied back up to about 102.1. The former resistance held as support, which completes the verification of the breakout. In my view, the USD Index is ready to soar again, and the medium-term rally I described on September 24 still has a lot of room to run. This might not seem to be the case based on the above chart, but the long-term chart provides proper context.
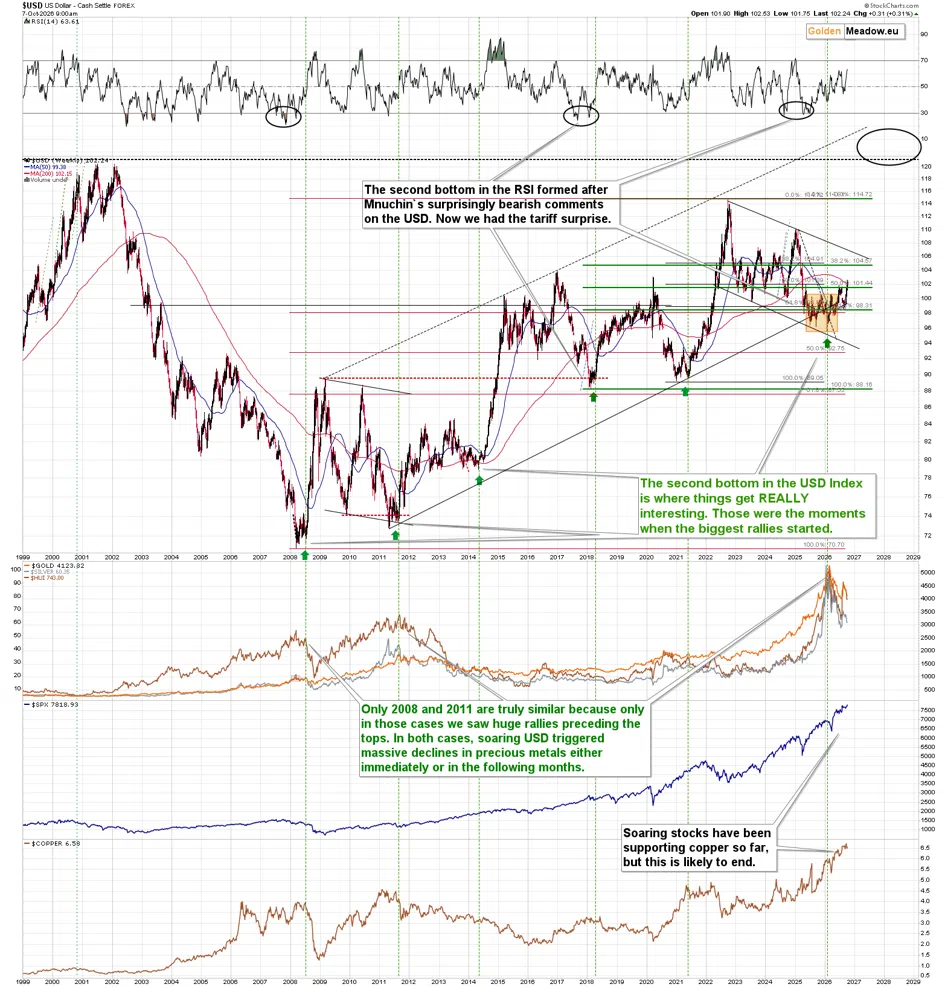
The implications for gold and the rest of the precious metals market are bearish – the forecasts that I made for September have already proven correct and the same is likely for the ones I made for October.
Stocks: Records On Weak Breadth
The S&P 500 closed at a record 7,818.93 on Tuesday, its first close above 7,800, and the Nasdaq also closed at a record. That is the strength the headlines will show you. The table shows what sits underneath it.
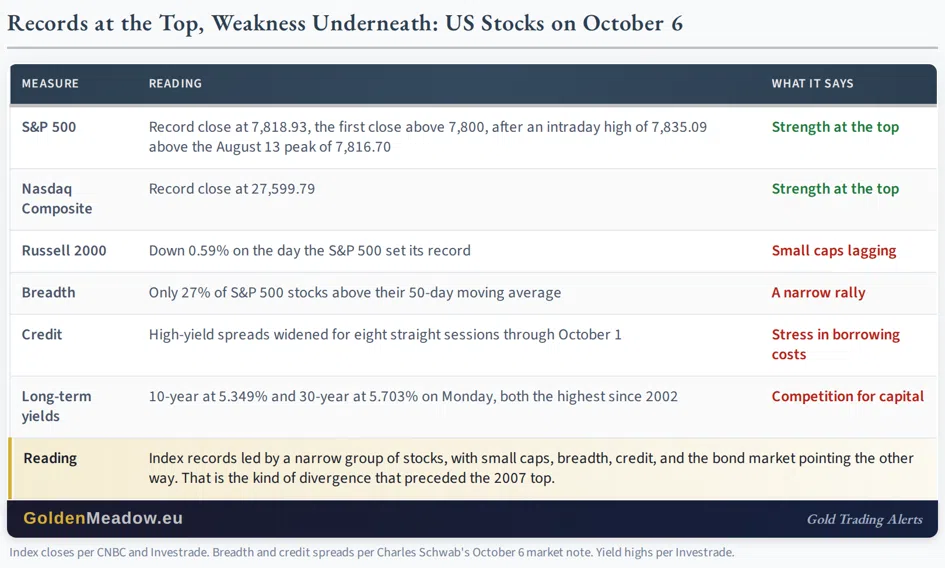
On Tuesday, I wrote: "The 2007 rally didn't imply the absence of the 2008 crash." The S&P 500 set its 2007 record in October, with credit spreads already widening and fewer stocks taking part in each new high. The current setup is a narrow rally led by technology, with small caps lagging, only 27 percent of S&P 500 stocks above their 50-day moving averages, and high-yield spreads widening for eight sessions in a row through last Thursday. Where This Leaves Us
Crude oil bottomed on the exact day the triangle-vertex technique flagged, which removes the one support gold had this week, and the USD Index verified its breakout and looks ready to soar again. Gold rose with the dollar's dip on Tuesday and is falling more than the dollar is rising today, the opposite of a bottoming sign, while silver leads the decline after outperforming on Monday. Stocks are at records on weak breadth and widening credit spreads.
Gold's support this week came from cheaper oil. Oil stopped falling on Tuesday.
Thank you for reading the free version of today’s analysis. The premium version (Gold Trading Alert) includes more specific analysis of gold, silver, and mining stocks as well as profit-take levels for our positions. Diamond Members get to enjoy also over ten other premium publications at the fraction of their individual prices. If that might be of interest to you, I invite you to review our premium services.
Thank you.
Sincerely,
Przemysław K. Radomski, CFA